Page 432 - Engineering Electromagnetics, 8th Edition
P. 432
414                ENGINEERING ELECTROMAGNETICS

                                     η 2 will in general be complex. Additionally, if region 2 is a perfect conductor, η 2 is
                                     zero, and so φ is equal to π;if η 2 is real and less than η 1 , φ is also equal to π; and if
                                     η 2 is real and greater than η 1 , φ is zero.
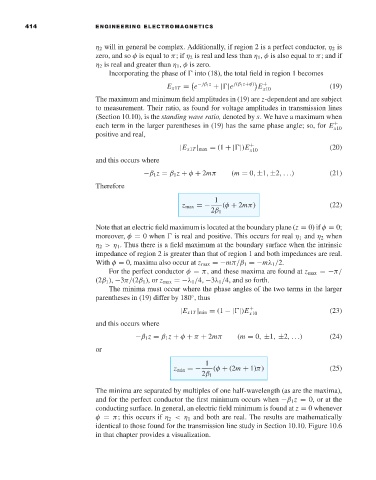
                                        Incorporating the phase of   into (18), the total field in region 1 becomes

                                                        E x1T = e − jβ 1 z  +| |e  j(β 1 z+φ)
 E  +  (19)

                                                                                  x10
                                     The maximum and minimum field amplitudes in (19) are z-dependent and are subject
                                     to measurement. Their ratio, as found for voltage amplitudes in transmission lines
                                     (Section 10.10), is the standing wave ratio, denoted by s.Wehavea maximum when
                                     each term in the larger parentheses in (19) has the same phase angle; so, for E  +
                                                                                                      x10
                                     positive and real,
                                                            |E x1T | max = (1 +| |)E  +              (20)
                                                                               x10
                                     and this occurs where
                                                  −β 1 z = β 1 z + φ + 2mπ  (m = 0, ±1, ±2,...)      (21)
                                     Therefore

                                                                     1
                                                            z max =−   (φ + 2mπ)                     (22)
                                                                    2β 1

                                     Note that an electric field maximum is located at the boundary plane (z = 0) if φ = 0;
                                     moreover, φ = 0 when   is real and positive. This occurs for real η 1 and η 2 when
                                     η 2 >η 1 . Thus there is a field maximum at the boundary surface when the intrinsic
                                     impedance of region 2 is greater than that of region 1 and both impedances are real.
                                     With φ = 0, maxima also occur at z max =−mπ/β 1 =−mλ 1 /2.
                                        For the perfect conductor φ = π, and these maxima are found at z max =−π/
                                     (2β 1 ), −3π/(2β 1 ), or z max =−λ 1 /4, −3λ 1 /4, and so forth.
                                        The minima must occur where the phase angles of the two terms in the larger
                                     parentheses in (19) differ by 180 , thus
                                                               ◦
                                                            |E x1T | min = (1 −| |)E x10             (23)
                                                                               +
                                     and this occurs where
                                                −β 1 z = β 1 z + φ + π + 2mπ  (m = 0, ±1, ±2,...)    (24)
                                     or
                                                                   1
                                                          z min =−   (φ + (2m + 1)π)                 (25)
                                                                  2β 1
                                     The minima are separated by multiples of one half-wavelength (as are the maxima),
                                     and for the perfect conductor the first minimum occurs when −β 1 z = 0, or at the
                                     conducting surface. In general, an electric field minimum is found at z = 0 whenever
                                     φ = π; this occurs if η 2 <η 1 and both are real. The results are mathematically
                                     identical to those found for the transmission line study in Section 10.10. Figure 10.6
                                     in that chapter provides a visualization.

