
Page 459 - Enhanced Oil Recovery in Shale and Tight Reservoirs
P. 459
426 Enhanced Oil Recovery in Shale and Tight Reservoirs
2.00E-04
1.80E-04
1.60E-04 C6-9
Cumulative Gas Mass, kg 1.20E-04 215 C C14-16
1.40E-04
C10-13
C17-19
1.00E-04
C20-22
o
8.00E-05
C23-25
6.00E-05
4.00E-05 C25+
2.00E-05
0.00E+00
0 50 100 150 200 250 300 350 400 450
o
Temperature, C
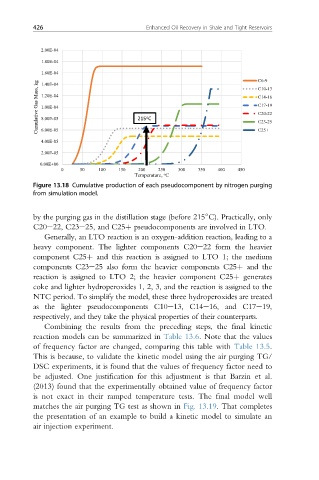
Figure 13.18 Cumulative production of each pseudocomponent by nitrogen purging
from simulation model.
by the purging gas in the distillation stage (before 215 C). Practically, only
C20e22, C23e25, and C25þ pseudocomponents are involved in LTO.
Generally, an LTO reaction is an oxygen-addition reaction, leading to a
heavy component. The lighter components C20e22 form the heavier
component C25þ and this reaction is assigned to LTO 1; the medium
components C23e25 also form the heavier components C25þ and the
reaction is assigned to LTO 2; the heavier component C25þ generates
coke and lighter hydroperoxides 1, 2, 3, and the reaction is assigned to the
NTC period. To simplify the model, these three hydroperoxides are treated
as the lighter pseudocomponents C10e13, C14e16, and C17e19,
respectively, and they take the physical properties of their counterparts.
Combining the results from the preceding steps, the final kinetic
reaction models can be summarized in Table 13.6.Notethatthe values
of frequency factor are changed, comparing this table with Table 13.5.
This is because, to validate the kinetic model using the air purging TG/
DSC experiments, it is found that the values of frequency factor need to
be adjusted. One justification for this adjustment is that Barzin et al.
(2013) found that the experimentally obtained value of frequency factor
is not exact in their ramped temperature tests. The final model well
matches the air purging TG test as shown in Fig. 13.19. That completes
the presentation of an example to build a kinetic model to simulate an
air injection experiment.