
Page 458 - Enhanced Oil Recovery in Shale and Tight Reservoirs
P. 458
Air injection 425
20
15
NTC
Nitrogen
10 Air
Heat flow, J/g/s 5 LTO LTO 2 Air - N2
0
0 50 100 150 200 250 300 350 400
-5
-10
Temperature °C
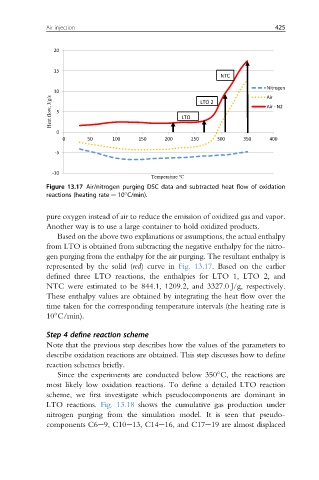
Figure 13.17 Air/nitrogen purging DSC data and subtracted heat flow of oxidation
reactions (heating rate ¼ 10 C/min).
pure oxygen instead of air to reduce the emission of oxidized gas and vapor.
Another way is to use a large container to hold oxidized products.
Based on the above two explanations or assumptions, the actual enthalpy
from LTO is obtained from subtracting the negative enthalpy for the nitro-
gen purging from the enthalpy for the air purging. The resultant enthalpy is
represented by the solid (red) curve in Fig. 13.17. Based on the earlier
defined three LTO reactions, the enthalpies for LTO 1, LTO 2, and
NTC were estimated to be 844.1, 1209.2, and 3327.0 J/g, respectively.
These enthalpy values are obtained by integrating the heat flow over the
time taken for the corresponding temperature intervals (the heating rate is
10 C/min).
Step 4 define reaction scheme
Note that the previous step describes how the values of the parameters to
describe oxidation reactions are obtained. This step discusses how to define
reaction schemes briefly.
Since the experiments are conducted below 350 C, the reactions are
most likely low oxidation reactions. To define a detailed LTO reaction
scheme, we first investigate which pseudocomponents are dominant in
LTO reactions. Fig. 13.18 shows the cumulative gas production under
nitrogen purging from the simulation model. It is seen that pseudo-
components C6e9, C10e13, C14e16, and C17e19 are almost displaced