
Page 165 - Entrophy Analysis in Thermal Engineering Systems
P. 165
160 Entropy Analysis in Thermal Engineering Systems
and assuming T s ¼900K. The dashed lines represent the special case of
Gibbs, where T s ¼T so that G m ¼G and Φ¼Φ G ; see Section 10.4.3.
The maximum entropy production and the minimum change in G m
coincide at ξ¼2.08. As the initial state is fixed, G m is independent of ξ
i
so only G m is a function of ξ. The minimum ΔG m corresponds to the min-
f
imum value of G m . On the other hand, the maximum entropy production
f
and the minimum ΔG (dashed lines in Fig. 10.3) coincide at ξ 1, which is
less than the optimum ξ that maximizes Φ and minimizes G m . From ther-
f
modynamic perspective, in the special case of Gibbs, the reaction may pro-
ceed up to a maximum value of ξ max 2.5 at which Φ G (ξ max )¼ΔG(ξ max )¼
0. The reaction cannot take place for ξ>2.5 which would otherwise violate
the second law. The reaction could only proceed for 0<ξ 2.5. In reality,
T s 6¼T and as seen in Fig. 10.3, Φ is always positive for the entire range of ξ
so the reaction may occur at any ξ without violating the laws of
thermodynamics.
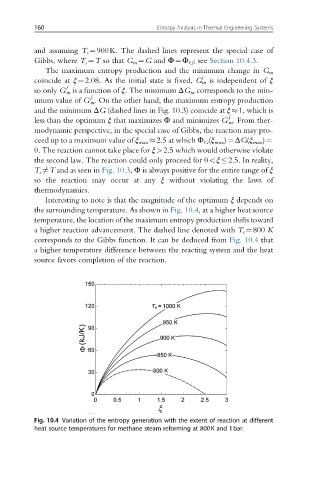
Interesting to note is that the magnitude of the optimum ξ depends on
the surrounding temperature. As shown in Fig. 10.4, at a higher heat source
temperature, the location of the maximum entropy production shifts toward
a higher reaction advancement. The dashed line denoted with T s ¼800 K
corresponds to the Gibbs function. It can be deduced from Fig. 10.4 that
a higher temperature difference between the reacting system and the heat
source favors completion of the reaction.
Fig. 10.4 Variation of the entropy generation with the extent of reaction at different
heat source temperatures for methane steam reforming at 800K and 1bar.