
Page 170 - Entrophy Analysis in Thermal Engineering Systems
P. 170
Entropy and chemical equilibrium 165
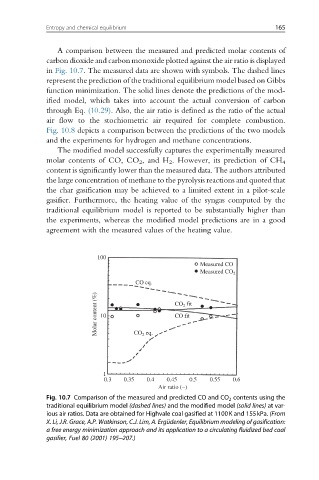
A comparison between the measured and predicted molar contents of
carbon dioxide and carbon monoxide plotted against the air ratio is displayed
in Fig. 10.7. The measured data are shown with symbols. The dashed lines
represent the prediction of the traditional equilibrium model based on Gibbs
function minimization. The solid lines denote the predictions of the mod-
ified model, which takes into account the actual conversion of carbon
through Eq. (10.29). Also, the air ratio is defined as the ratio of the actual
air flow to the stochiometric air required for complete combustion.
Fig. 10.8 depicts a comparison between the predictions of the two models
and the experiments for hydrogen and methane concentrations.
The modified model successfully captures the experimentally measured
molar contents of CO, CO 2 , and H 2 . However, its prediction of CH 4
content is significantly lower than the measured data. The authors attributed
the large concentration of methane to the pyrolysis reactions and quoted that
the char gasification may be achieved to a limited extent in a pilot-scale
gasifier. Furthermore, the heating value of the syngas computed by the
traditional equilibrium model is reported to be substantially higher than
the experiments, whereas the modified model predictions are in a good
agreement with the measured values of the heating value.
100
Measured CO
Measured CO 2
CO eq.
Molar content (%) 10 CO 2 eq. CO fit
2
CO fit
1
0.3 0.35 0.4 0.45 0.5 0.55 0.6
Air ratio (−)
Fig. 10.7 Comparison of the measured and predicted CO and CO 2 contents using the
traditional equilibrium model (dashed lines) and the modified model (solid lines) at var-
ious air ratios. Data are obtained for Highvale coal gasified at 1100K and 155kPa. (From
X. Li, J.R. Grace, A.P. Watkinson, C.J. Lim, A. Erg€ udenler, Equilibrium modeling of gasification:
a free energy minimization approach and its application to a circulating fluidized bed coal
gasifier, Fuel 80 (2001) 195–207.)