
Page 167 - Entrophy Analysis in Thermal Engineering Systems
P. 167
162 Entropy Analysis in Thermal Engineering Systems
at 98%, 99.99%, etc. conversion. The main idea here is to highlight the phys-
ical meaning of the chemical equilibrium defined previously; see Fig. 10.1C.
Fig. 10.5 reveals that calculations performed by maximization of entropy
generation (or minimization of ΔG m ) could lead to incorrect prediction of
the equilibrium concentrations. However, as evident in Fig. 10.4, the loca-
tion of maximum entropy production (and thus minimum ΔG m ) shifts
toward the completion of the reaction as the temperature of the heat source
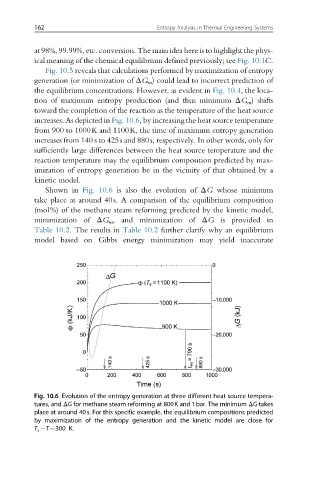
increases. As depicted in Fig. 10.6, by increasing the heat source temperature
from 900 to 1000K and 1100K, the time of maximum entropy generation
increases from 140 s to 425s and 880s, respectively. In other words, only for
sufficiently large differences between the heat source temperature and the
reaction temperature may the equilibrium composition predicted by max-
imization of entropy generation be in the vicinity of that obtained by a
kinetic model.
Shown in Fig. 10.6 is also the evolution of ΔG whose minimum
take place at around 40s. A comparison of the equilibrium composition
(mol%) of the methane steam reforming predicted by the kinetic model,
minimization of ΔG m , and minimization of ΔG is provided in
Table 10.2. The results in Table 10.2 further clarify why an equilibrium
model based on Gibbs energy minimization may yield inaccurate
Fig. 10.6 Evolution of the entropy generation at three different heat source tempera-
tures, and ΔG for methane steam reforming at 800K and 1bar. The minimum ΔG takes
place at around 40s. For this specific example, the equilibrium compositions predicted
by maximization of the entropy generation and the kinetic model are close for
T s T 300 K.