
Page 208 - Excel Timesaving Techniques for Dummies
P. 208
40_574272 ch35.qxd 10/1/04 10:54 PM Page 193
193
Subtotaling a Table or List
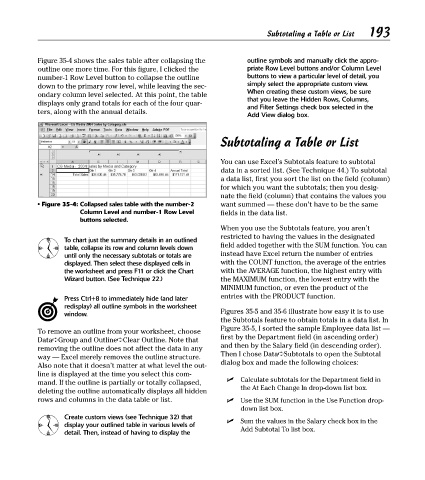
Figure 35-4 shows the sales table after collapsing the outline symbols and manually click the appro-
outline one more time. For this figure, I clicked the priate Row Level buttons and/or Column Level
number-1 Row Level button to collapse the outline buttons to view a particular level of detail, you
down to the primary row level, while leaving the sec- simply select the appropriate custom view.
When creating these custom views, be sure
ondary column level selected. At this point, the table
that you leave the Hidden Rows, Columns,
displays only grand totals for each of the four quar-
and Filter Settings check box selected in the
ters, along with the annual details.
Add View dialog box.
Subtotaling a Table or List
You can use Excel’s Subtotals feature to subtotal
data in a sorted list. (See Technique 44.) To subtotal
a data list, first you sort the list on the field (column)
for which you want the subtotals; then you desig-
nate the field (column) that contains the values you
• Figure 35-4: Collapsed sales table with the number-2 want summed — these don’t have to be the same
Column Level and number-1 Row Level fields in the data list.
buttons selected.
When you use the Subtotals feature, you aren’t
restricted to having the values in the designated
To chart just the summary details in an outlined
table, collapse its row and column levels down field added together with the SUM function. You can
until only the necessary subtotals or totals are instead have Excel return the number of entries
displayed. Then select these displayed cells in with the COUNT function, the average of the entries
the worksheet and press F11 or click the Chart with the AVERAGE function, the highest entry with
Wizard button. (See Technique 22.) the MAXIMUM function, the lowest entry with the
MINIMUM function, or even the product of the
entries with the PRODUCT function.
Press Ctrl+8 to immediately hide (and later
redisplay) all outline symbols in the worksheet
window. Figures 35-5 and 35-6 illustrate how easy it is to use
the Subtotals feature to obtain totals in a data list. In
Figure 35-5, I sorted the sample Employee data list —
To remove an outline from your worksheet, choose
Data➪Group and Outline➪Clear Outline. Note that first by the Department field (in ascending order)
and then by the Salary field (in descending order).
removing the outline does not affect the data in any
way — Excel merely removes the outline structure. Then I chose Data➪Subtotals to open the Subtotal
dialog box and made the following choices:
Also note that it doesn’t matter at what level the out-
line is displayed at the time you select this com-
Calculate subtotals for the Department field in
mand. If the outline is partially or totally collapsed,
deleting the outline automatically displays all hidden the At Each Change In drop-down list box.
rows and columns in the data table or list. Use the SUM function in the Use Function drop-
down list box.
Create custom views (see Technique 32) that Sum the values in the Salary check box in the
display your outlined table in various levels of Add Subtotal To list box.
detail. Then, instead of having to display the