
Page 303 - Facility Piping Systems Handbook for Industrial, Commercial, and Healthcare Facilities
P. 303
SITE UTILITY SYSTEMS
SITE UTILITY SYSTEMS 6.25
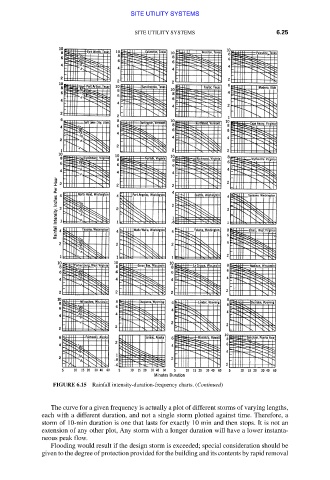
FIGURE 6.15 Rainfall intensity-duration-frequency charts. (Continued)
The curve for a given frequency is actually a plot of different storms of varying lengths,
each with a different duration, and not a single storm plotted against time. Therefore, a
storm of 10-min duration is one that lasts for exactly 10 min and then stops. It is not an
extension of any other plot, Any storm with a longer duration will have a lower instanta-
neous peak flow.
Flooding would result if the design storm is exceeded; special consideration should be
given to the degree of protection provided for the building and its contents by rapid removal
Downloaded from Digital Engineering Library @ McGraw-Hill (www.accessengineeringlibrary.com)
Copyright © 2009 The McGraw-Hill Companies. All rights reserved.
Any use is subject to the Terms of Use as given at the website.