
Page 298 - Facility Piping Systems Handbook for Industrial, Commercial, and Healthcare Facilities
P. 298
SITE UTILITY SYSTEMS
6.20 CHAPTER SIX
reaches the Drainage Inlet (DI) can never be exactly determined. Because of this unpredict-
ability, it is important to realize that some judgment is required in applying the calculated
and obtained information in the design of a storm water system.
The storm water drainage system is generally designed to remove the maximum expected
runoff as quickly as it falls to avoid ponding or flooding. The ability to calculate the flow
rate is complicated by not being able to accurately predict many of the factors affecting the
actual amount of runoff resulting from any given storm. In order to calculate the estimated
maximum runoff, an artificial “design storm” must be created. This storm will serve as a
simulation capable of predicting runoff volume accurately enough to provide a basis for the
design of the piping network.
The design storm is based on actual rainfall records, and has been presented in a con-
venient form by the National Oceanic and Atmospheric Administration/National Weather
Service (NOAA). Design storms are available as either intensity-duration-frequency curves
or as charts and formulas appearing in several technical memorandum covering different
areas of the United States. The intensity-duration-frequency charts are in a very convenient,
easy to use form and are considered accurate for the small watersheds that are the subject
of this handbook. Charts for various cities throughout the United States are presented in
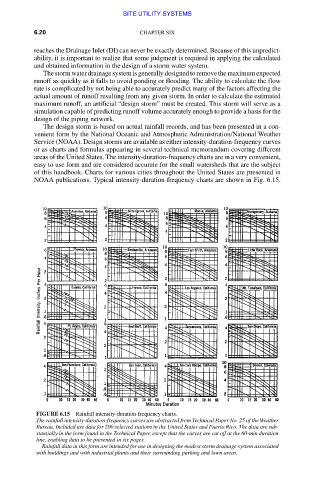
NOAA publications. Typical intensity-duration-frequency charts are shown in Fig. 6.15.
FIGURE 6.15 Rainfall intensity-duration-frequency charts.
The rainfall intensity-duration-frequency curves are abstracted from Technical Paper No. 25 of the Weather
Bureau. Included are data for 200 selected stations in the United States and Puerto Rico. The data are sub-
stantially in the form found in the Technical Paper, except that the curves are cut off at the 60-min duration
line, enabling data to be presented in six pages.
Rainfall data in this form are intended for use in designing the modest storm drainage system associated
with buildings and with industrial plants and their surrounding parking and lawn areas.
Downloaded from Digital Engineering Library @ McGraw-Hill (www.accessengineeringlibrary.com)
Copyright © 2009 The McGraw-Hill Companies. All rights reserved.
Any use is subject to the Terms of Use as given at the website.