
Page 301 - Facility Piping Systems Handbook for Industrial, Commercial, and Healthcare Facilities
P. 301
SITE UTILITY SYSTEMS
SITE UTILITY SYSTEMS 6.23
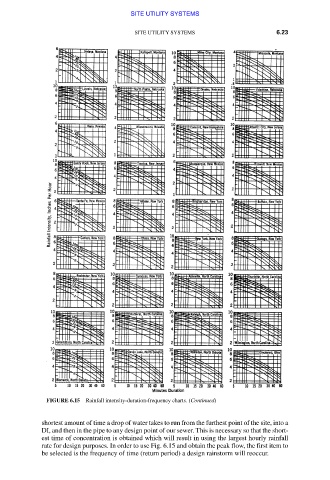
FIGURE 6.15 Rainfall intensity-duration-frequency charts. (Continued)
shortest amount of time a drop of water takes to run from the furthest point of the site, into a
DI, and then in the pipe to any design point of our sewer. This is necessary so that the short-
est time of concentration is obtained which will result in using the largest hourly rainfall
rate for design purposes. In order to use Fig. 6.15 and obtain the peak flow, the first item to
be selected is the frequency of time (return period) a design rainstorm will reoccur.
Downloaded from Digital Engineering Library @ McGraw-Hill (www.accessengineeringlibrary.com)
Copyright © 2009 The McGraw-Hill Companies. All rights reserved.
Any use is subject to the Terms of Use as given at the website.