
Page 299 - Facility Piping Systems Handbook for Industrial, Commercial, and Healthcare Facilities
P. 299
SITE UTILITY SYSTEMS
SITE UTILITY SYSTEMS 6.21
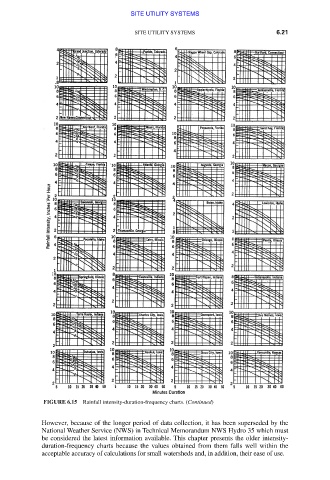
FIGURE 6.15 Rainfall intensity-duration-frequency charts. (Continued)
However, because of the longer period of data collection, it has been superseded by the
National Weather Service (NWS) in Technical Memorandum NWS Hydro 35 which must
be considered the latest information available. This chapter presents the older intensity-
duration-frequency charts because the values obtained from them falls well within the
acceptable accuracy of calculations for small watersheds and, in addition, their ease of use.
Downloaded from Digital Engineering Library @ McGraw-Hill (www.accessengineeringlibrary.com)
Copyright © 2009 The McGraw-Hill Companies. All rights reserved.
Any use is subject to the Terms of Use as given at the website.