
Page 104 - Failure Analysis Case Studies II
P. 104
89
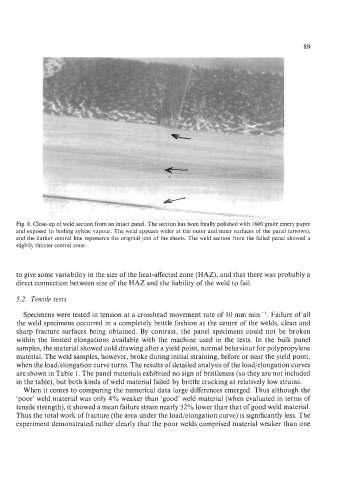
Fig. 8. Close-up of weld section from an intact panel. The section has been finally polished with 1600 grade emery paper
and exposed to boiling xylene vapour. The weld appears wider at the outer and inner surfaces of the panel (arrows),
and the darker central line represents the original join of the sheets. The weld section from the failed panel showed a
slightly thinner central zone.
to give some variability in the size of the heat-affected zone (HAZ), and that there was probably a
direct connection between size of the HAZ and the liability of the weld to fail.
5.2. Tensile tests
Specimens were tested in tension at a crosshead movement rate of 10 mm min-’. Failure of all
the weld specimens occurred in a completely brittle fashion at the centre of the welds, clean and
sharp fracture surfaces being obtained. By contrast, the panel specimens could not be broken
within the limited elongations available with the machine used in the tests. In the bulk panel
samples, the material showed cold drawing after a yield point, normal behaviour for polypropylene
material. The weld samples, however, broke during initial straining, before or near the yield point,
when the load/elongation curve turns. The results of detailed analysis of the load/elongation curves
are shown in Table 1. The panel materials exhibited no sign of brittleness (so they are not included
in the table), but both kinds of weld material failed by brittle cracking at relatively low strains.
When it comes to comparing the numerical data large differences emerged. Thus although the
‘poor’ weld material was only 4% weaker than ‘good’ weld material (when evaluated in terms of
tensile strength), it showed a mean failure strain nearly 32% lower than that of good weld material.
Thus the total work of fracture (the area under the load/elongation curve) is significantly less. The
experiment demonstrated rather clearly that the poor welds comprised material weaker than one