
Page 121 - Failure Analysis Case Studies II
P. 121
I06
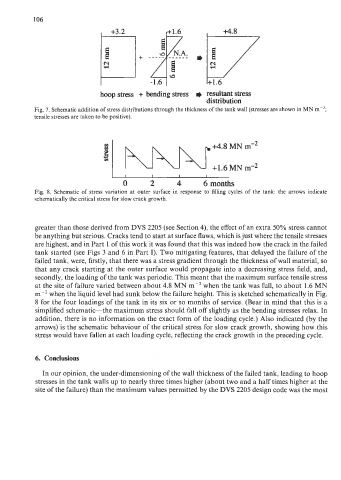
+3.2 1+1.6 4.8
-1.6 I
hoop stress + bending stress resultant stress
distribution
Fig. 7. Schematic addition of stress distributions through the thickness of the tank wall (stresses are shown in MN m-’;
tensile stresses are taken to be positive).
I 1 I I
0 2 4 6 months
Fig. 8. Schematic of stress variation at outer surface in response to filling cycles of the tank: the arrows indicate
schematically the critical stress for slow crack growth.
greater than those derived from DVS 2205 (see Section 4), the effect of an extra 50% stress cannot
be anything but serious. Cracks tend to start at surface flaws, which is just where the tensile stresses
are highest, and in Part 1 of this work it was found that this was indeed how the crack in the failed
tank started (see Figs 3 and 6 in Part I). Two mitigating features, that delayed the failure of the
failed tank, were, firstly, that there was a stress gradient through the thickness of wall material, so
that any crack starting at the outer surface would propagate into a decreasing stress field, and,
secondly, the loading of the tank was periodic. This meant that the maximum surface tensile stress
at the site of failure varied between about 4.8 MN m-2 when the tank was full, to about 1.6 MN
m-2 when the liquid level had sunk below the failure height. This is sketched schematically in Fig.
8 for the four loadings of the tank in its six or so months of service. (Bear in mind that this is a
simplified schematic-the maximum stress should fall off slightly as the bending stresses relax. In
addition, there is no information on the exact form of the loading cycle.) Also indicated (by the
arrows) is the schematic behaviour of the critical stress for slow crack growth, showing how this
stress would have fallen at each loading cycle, reflecting the crack growth in the preceding cycle.
6. Conclusions
In our opinion, the under-dimensioning of the wall thickness of the failed tank, leading to hoop
stresses in the tank walls up to nearly three times higher (about two and a half times higher at the
site of the failure) than the maximum values permitted by the DVS 2205 design code was the most