
Page 229 - Failure Analysis Case Studies II
P. 229
_.
I
I
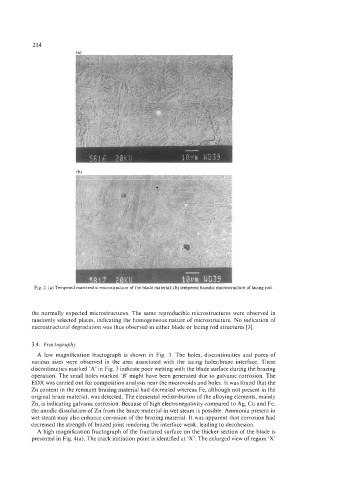
Fig. 2. (a) Tempered martensitic microstructure of the blade material; (b) tempered batnitic microstructure of lacing rod.
the normally expected microstructures. The same reproducible microstructures were observed in
randomly selected places, indicating the homogeneous nature of microstructure. No indication of
microstructural degradation was thus observed in either blade or lacing rod structures [3].
3.4. Fractography
A low magnification fractograph is shown in Fig. 3. The holes, discontinuities and pores of
various sizes were observed in the area associated with the lacing holes/braze interface. These
discontinuities marked ‘A’ in Fig. 3 indicate poor wetting with the blade surface during the brazing
operation. The small holes marked ‘B’ might have been generated due to galvanic corrosion. The
EDX was carried out for composition analysis near the microvoids and holes. It was found that the
Zn content in the remnant brazing material had decreased whereas Fe, although not present in the
original braze material, was detected. The elemental redistribution of the alloying elements, mainly
Zn, is indicating galvanic corrosion. Because of high electronegativity compared to Ag, Cu and Fe,
the anodic dissolution of Zn from the braze material in wet steam is possible. Ammonia present in
wet steam may also enhance corrosion of the brazing material. It was apparent that corrosion had
decreased the strength of brazed joint rendering the interface weak, leading to decohesion.
A high magnification fractograph of the fractured surface on the thicker section of the blade is
presented in Fig. 4(a). The crack initiation point is identified at ‘X’. The enlarged view of region ‘X’