
Page 232 - Failure Analysis Case Studies II
P. 232
217
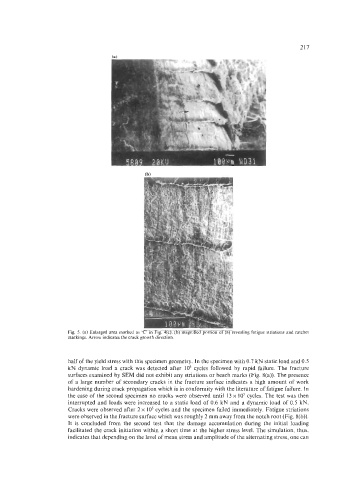
Fig. 5. (a)
markings.
half of the yield stress with this specimen geometry. In the specimen with 0.7 kN static load and 0.5
kN dynamic load a crack was detected after lo4 cycles followed by rapid failure. The fracture
surfaces examined by SEM did not exhibit any striations or beach marks (Fig. 8(a)). The presence
of a large number of secondary cracks in the fracture surface indicates a high amount of work
hardening during crack propagation which is in conformity with the literature of fatigue failure. In
the case of the second specimen no cracks were observed until 13 x lo5 cycles. The test was then
interrupted and loads were increased to a static load of 0.6 kN and a dynamic load of 0.5 kN.
Cracks were observed after 2 x lo5 cycles and the specimen failed immediately. Fatigue striations
were observed in the fracture surface which was roughly 2 mm away from the notch root (Fig. 8(b)).
It is concluded from the second test that the damage accumulation during the initial loading
facilitated the crack initiation within a short time at the higher stress level. The simulation, thus,
indicates that depending on the level of mean stress and amplitude of the alternating stress, one can