
Page 242 - Failure Analysis Case Studies II
P. 242
1
227
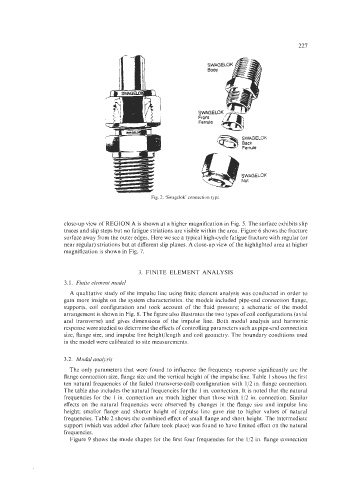
SWAGELCK
8acrC
Ferrule
Fig. 2. ‘Swagelok’ connection type
close-up view of REGION A is shown at a higher magnification in Fig. 5. The surface exhibits slip
traces and slip steps but no fatigue striations are visible within the area. Figure 6 shows the fracture
surface away from the outer edges. Here we see a typical high-cycle fatigue fracture with regular (or
near regular) striations but at different slip planes. A close-up view of the highlighted area at higher
magnification is shown in Fig. 7.
3. FINITE ELEMENT ANALYSIS
3.1. Finite element model
A qualitative study of the impulse line using finite element analysis was conducted in order to
gain more insight on the system characteristics. the models included pipe-end connection flange,
supports, coil configuration and took account of the fluid pressure; a schematic of the model
arrangement is shown in Fig. 8. The figure also illustrates the two types of coil configurations (axial
and transverse) and gives dimensions of the impulse line. Both modal analysis and harmonic
response were studied to determine the effects of controlling parameters such as pipe-end connection
size, flange size, and impulse line height/length and coil geometry. The boundary conditions used
in the model were calibrated to site measurements.
3.2. Modal analysis
The only parameters that were found to influence the frequency response significantly are the
flange connection size, flange size and the vertical height of the impulse line. Table 1 shows the first
ten natural frequencies of the failed (transverse-coil) configuration with 1/2 in. flange connection.
The table also includes the natural frequencies for the 1 in. connection. It is noted that the natural
frequencies for the 1 in. connection are much higher than those with 1/2 in. connection. Similar
effects on the natural frequencies were observed by changes in the flange size and impulse line
height; smaller flange and shorter height of impulse line gave rise to higher values of natural
frequencies. Table 2 shows the combined effect of small flange and short height. The intermediate
support (which was added after failure took place) was found to have limited effect on the natural
frequencies.
Figure 9 shows the mode shapes for the first four frequencies for the 1/2 in. flange connection