
Page 314 - Failure Analysis Case Studies II
P. 314
299
11. Polmear, I. J., Light Alloys. Arnold, London, 1981.
12. Hollingsworth, E. H. and Hunsicker, H. Y., in Merals Handbook, Vol. 13, 9th edn: Corrosion. American Society for
Metals, Metals Park, OH, 1987, p. 583.
13. Evans, U. R., An Introduction to Metallic Corrosion, 2nd edn. Arnold, London, 1975.
14. Durrant, P. J., General and Inorganic Chemistry, 2nd edn. Longmans, London, 1952.
15. LaQue, F. L. and Copson, H. R., Corrosion Resistance of Metals and Alloys, 2nd edn. Reinhold, New York, 1963.
16. Uhlig, H., The Corrosion Handbook. Wiley, New York, 1948.
17. Evans, U. R., The Corrosion and Oxidation of Metals, 2nd supplement. Arnold, London, 1976.
APPENDIX A: POURBAIX DIAGRAMS
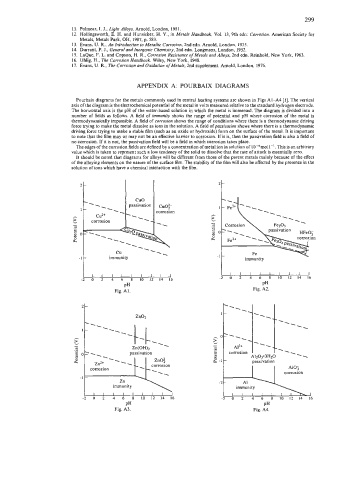
Pourbaix diagrams for the metals commonly used in central heating systems are shown in Figs Al-A4 [I]. The vertical
axis of the diagram is the electrochemical potential of the metal in volts measured relative to the standard hydrogen electrode.
The horizontal axis is the pH of the water-based solution in which the metal is immersed. The diagram is divided into a
number of fields as follows. A field of immunity shows the range of potential and pH where corrosion of the metal is
thermodynamically impossible. A field of corrosion shows the range of conditions where there is a thermodynamic driving
force trying to make the metal dissolve as ions in the solution. A field of passivation shows where there is a thermodynamic
driving force trying to make a stable film (such as an oxide or hydroxide) form on the surface of the metal. It is important
to note that the film may or may not be an effective barrier to corrosion. If it is, then the passivation field is also a field of
no corrosion. If it is not, the passivation field will be a field in which corrosion takes place.
The edges of the corrosion fields are defined by a concentration of metal ion in solution of 10-bmol I-’. This is an arbitrary
value which is taken to represent such a low tendency of the solid to dissolve that the rate of attack is essentially zero.
It should be noted that diagrams for alloys will be different from those of the parent metals mainly because of the effect
of the alloying elements on the nature of the surface film. The stability of the film will also be affected by the presence in the
solution of ions which have a chemical interaction with the film.
-2 0 2 4 6 8 10 12 14 16
-2 0 2 4 6 8 IO 12 14 16
PH PH
Fig. AI. Fig. A2.
Zn02
1-
h
5. ...c.
.- Zn(0H)j
-+ .. passivation
e 0-+. zn2+ - - .
._
corrosion . corrosion AlOj
corrosion
-I -
Zn
immunity immunity
I I I I I I I I I
-2 0 2 4 6 8 10 12 14 16 -2 0 2 4 6 8 IO 12 14 16
PH PH
Fig. A3. Fig. A4.