
Page 381 - Failure Analysis Case Studies II
P. 381
366
Table 1. Specifications for AISI 431 and ‘En 57’ stainless steel, and the chemical analysis of the chain pins
Yo c %Cr %Ni %Mn %Si %S %P
Specification for AISI 43 1 0.2max 15-17 1.21-2.5 1 max 1 max 0.03 max 0.04max
Specification for ‘En 57’ 0.12-0.2 15-18 2.e3.0 1 max 1 max 0.03 max 0.04max
Pin A (fractured) 0.16 15.2 2.54 0.42 0.36 0.021 0.019
Pin B (fractured) 0.15 15.2 2.54 0.42 0.37 0.019 0.018
Pin C (fractured) 0.16 17.2 2.88 0.52 0.54 0.020 0.022
Pin N1 (not fractured) 0.15 15.2 2.55 0.42 0.37 0.002 0.019
Table 2. Vickers hardness measurements (HV,,)
Pin Average Standard deviation Rockwell ‘C’ equivalent
A (fractured) 470 4.1 46
B (fractured) 476 8.0 47
C (fractured) 464 1.5 46
NI (not fractured) 461 6.5 46
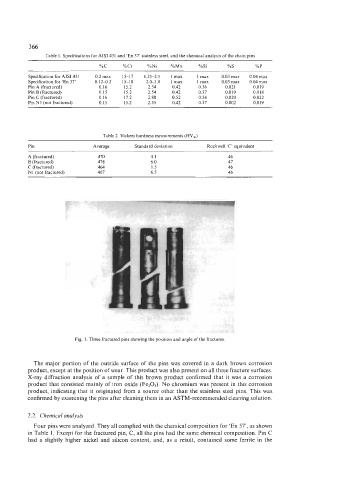
Fig. 1. Three fractured pins showing the position and angle of the fractures
The major portion of the outside surface of the pins was covered in a dark brown corrosion
product, except at the position of wear. This product was also present on all three fracture surfaces.
X-ray diffraction analysis of a sample of this brown product confirmed that it was a corrosion
product that consisted mainly of iron oxide (Fe,O,). No chromium was present in this corrosion
product, indicating that it originated from a source other than the stainless steel pins. This was
confirmed by examining the pins after cleaning them in an ASTM-recommended cleaning solution.
2.2. Chemical analysis
Four pins were analyzed. They all complied with the chemical composition for ‘En 57’, as shown
in Table 1. Except for the fractured pin, C, all the pins had the same chemical composition. Pin C
had a slightly higher nickel and silicon content, and, as a result, contained some ferrite in the