
Page 279 - Finite Element Modeling and Simulations with ANSYS Workbench
P. 279
264 Finite Element Modeling and Simulation with ANSYS Workbench
u
t
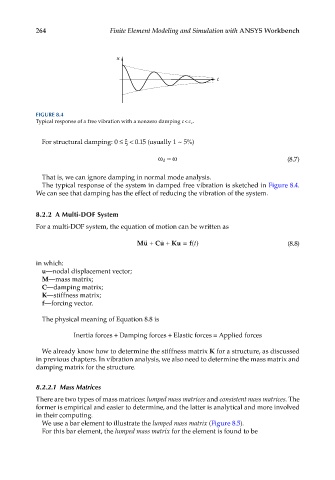
FIGURE 8.4
<
Typical response of a free vibration with a nonzero damping cc c .
For structural damping: 0 ≤ ξ < 0.15 (usually 1 ~ 5%)
ω≈ ω (8.7)
d
That is, we can ignore damping in normal mode analysis.
The typical response of the system in damped free vibration is sketched in Figure 8.4.
We can see that damping has the effect of reducing the vibration of the system.
8.2.2 A Multi-DOF System
For a multi-DOF system, the equation of motion can be written as
Mu + Cu + Ku = f() (8.8)
t
in which:
u—nodal displacement vector;
M—mass matrix;
C—damping matrix;
K—stiffness matrix;
f—forcing vector.
The physical meaning of Equation 8.8 is
Inertia forces + Damping forces + Elastic forces = Applied forces
We already know how to determine the stiffness matrix K for a structure, as discussed
in previous chapters. In vibration analysis, we also need to determine the mass matrix and
damping matrix for the structure.
8.2.2.1 Mass Matrices
There are two types of mass matrices: lumped mass matrices and consistent mass matrices. The
former is empirical and easier to determine, and the latter is analytical and more involved
in their computing.
We use a bar element to illustrate the lumped mass matrix (Figure 8.5).
For this bar element, the lumped mass matrix for the element is found to be