
Page 322 - Finite Element Modeling and Simulations with ANSYS Workbench
P. 322
Thermal Analysis 307
MN
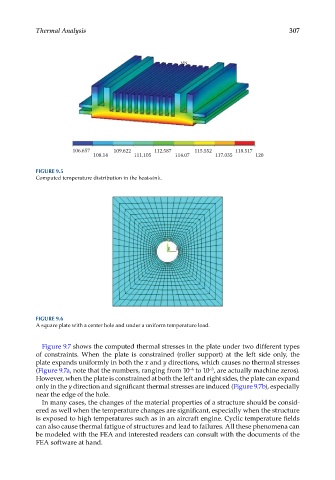
106.657 109.622 112.587 115.552 118.517
108.14 111.105 114.07 117.035 120
FIGURE 9.5
Computed temperature distribution in the heat-sink.
FIGURE 9.6
A square plate with a center hole and under a uniform temperature load.
Figure 9.7 shows the computed thermal stresses in the plate under two different types
of constraints. When the plate is constrained (roller support) at the left side only, the
plate expands uniformly in both the x and y directions, which causes no thermal stresses
−6
(Figure 9.7a, note that the numbers, ranging from 10 to 10 , are actually machine zeros).
−3
However, when the plate is constrained at both the left and right sides, the plate can expand
only in the y direction and significant thermal stresses are induced (Figure 9.7b), especially
near the edge of the hole.
In many cases, the changes of the material properties of a structure should be consid-
ered as well when the temperature changes are significant, especially when the structure
is exposed to high temperatures such as in an aircraft engine. Cyclic temperature fields
can also cause thermal fatigue of structures and lead to failures. All these phenomena can
be modeled with the FEA and interested readers can consult with the documents of the
FEA software at hand.