
Page 150 - Flexible Robotics in Medicine
P. 150
136 Chapter 5
Figure 5.29
Graph of longitudinal displacement against time.
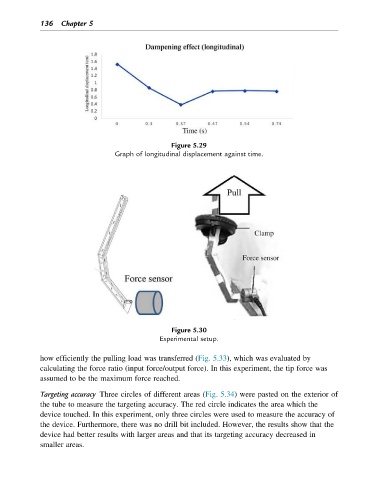
Figure 5.30
Experimental setup.
how efficiently the pulling load was transferred (Fig. 5.33), which was evaluated by
calculating the force ratio (input force/output force). In this experiment, the tip force was
assumed to be the maximum force reached.
Targeting accuracy Three circles of different areas (Fig. 5.34) were pasted on the exterior of
the tube to measure the targeting accuracy. The red circle indicates the area which the
device touched. In this experiment, only three circles were used to measure the accuracy of
the device. Furthermore, there was no drill bit included. However, the results show that the
device had better results with larger areas and that its targeting accuracy decreased in
smaller areas.