
Page 165 - Fluid Mechanics and Thermodynamics of Turbomachinery
P. 165
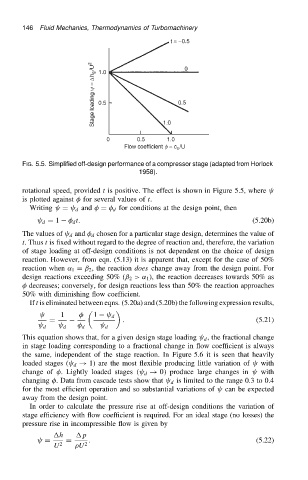
146 Fluid Mechanics, Thermodynamics of Turbomachinery
FIG. 5.5. Simplified off-design performance of a compressor stage (adapted from Horlock
1958).
rotational speed, provided t is positive. The effect is shown in Figure 5.5, where
is plotted against for several values of t.
Writing D d and D d for conditions at the design point, then
d D 1 d t. (5.20b)
The values of d and d chosen for a particular stage design, determines the value of
t. Thus t is fixed without regard to the degree of reaction and, therefore, the variation
of stage loading at off-design conditions is not dependent on the choice of design
reaction. However, from eqn. (5.13) it is apparent that, except for the case of 50%
reaction when ˛ 1 D ˇ 2 , the reaction does change away from the design point. For
design reactions exceeding 50% (ˇ 2 >˛ 1 ), the reaction decreases towards 50% as
decreases; conversely, for design reactions less than 50% the reaction approaches
50% with diminishing flow coefficient.
If t is eliminated between eqns. (5.20a) and (5.20b) the following expression results,
1 1 d
D . (5.21)
d d d d
This equation shows that, for a given design stage loading d , the fractional change
in stage loading corresponding to a fractional change in flow coefficient is always
the same, independent of the stage reaction. In Figure 5.6 it is seen that heavily
loaded stages ( d ! 1) are the most flexible producing little variation of with
change of . Lightly loaded stages . d ! 0/ produce large changes in with
changing . Data from cascade tests show that d is limited to the range 0.3 to 0.4
for the most efficient operation and so substantial variations of can be expected
away from the design point.
In order to calculate the pressure rise at off-design conditions the variation of
stage efficiency with flow coefficient is required. For an ideal stage (no losses) the
pressure rise in incompressible flow is given by
h p
D D . (5.22)
U 2 U 2