
Page 286 - Fluid Mechanics and Thermodynamics of Turbomachinery
P. 286
Radial Flow Gas Turbines 267
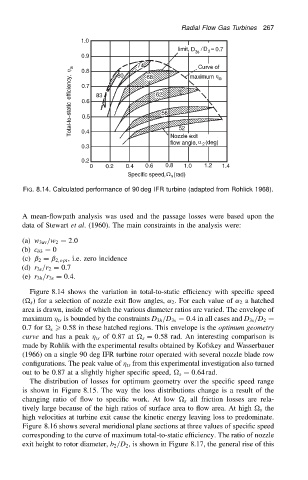
FIG. 8.14. Calculated performance of 90 deg IFR turbine (adapted from Rohlick 1968).
A mean-flowpath analysis was used and the passage losses were based upon the
data of Stewart et al. (1960). The main constraints in the analysis were:
(a) w 3av /w 2 D 2.0
(b) c 3 D 0
(c) ˇ 2 D ˇ 2,opt , i.e. zero incidence
(d) r 3s /r 2 D 0.7
(e) r 3h /r 3s D 0.4.
Figure 8.14 shows the variation in total-to-static efficiency with specific speed
( s ) for a selection of nozzle exit flow angles, ˛ 2 . For each value of ˛ 2 a hatched
area is drawn, inside of which the various diameter ratios are varied. The envelope of
maximum ts is bounded by the constraints D 3h /D 3s D 0.4 in all cases and D 3s /D 2 D
0.7 for s > 0.58 in these hatched regions. This envelope is the optimum geometry
curve and has a peak ts of 0.87 at s D 0.58 rad. An interesting comparison is
made by Rohlik with the experimental results obtained by Kofskey and Wasserbauer
(1966) on a single 90 deg IFR turbine rotor operated with several nozzle blade row
configurations. The peak value of ts from this experimental investigation also turned
out to be 0.87 at a slightly higher specific speed, s D 0.64 rad.
The distribution of losses for optimum geometry over the specific speed range
is shown in Figure 8.15. The way the loss distributions change is a result of the
changing ratio of flow to specific work. At low s all friction losses are rela-
tively large because of the high ratios of surface area to flow area. At high s the
high velocities at turbine exit cause the kinetic energy leaving loss to predominate.
Figure 8.16 shows several meridional plane sections at three values of specific speed
corresponding to the curve of maximum total-to-static efficiency. The ratio of nozzle
exit height to rotor diameter, b 2 /D 2 , is shown in Figure 8.17, the general rise of this