
Page 271 - Fluid-Structure Interactions Slender Structure and Axial Flow (Volume 1)
P. 271
,
252 SLENDER STRUCTURES AND AXIAL FLOW
2.4
2.0
1.5
1 :
1 .o
0.5
0
P P
(a) (b)
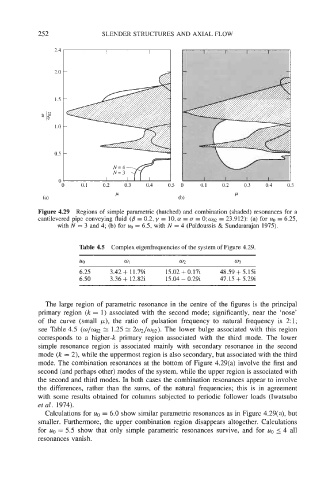
Figure 4.29 Regions of simple parametric (hatched) and combination (shaded) resonances for a
cantilevered pipe conveying fluid (p = 0.2, y = 10, a = (T = O;w02 = 23.912): (a) for uo = 6.25,
with N = 3 and 4; (b) for uo = 6.5, with N = 4 (Pdidoussis & Sundararajan 1975).
Table 4.5 Complex eigenfrequencies of the system of Figure 4.29.
uo W wz w3
6.25 3.42 + 11.79i 15.02 + 0.17i 48.59 + 5.15
6.50 3.36 + 12.82i 15.04 - 0.29i 47.15 + 5.29i
The large region of parametric resonance in the centre of the figures is the principal
primary region (k = 1) associated with the second mode; significantly, near the ‘nose’
of the curve (small p), the ratio of pulsation frequency to natural frequency is 2:l;
see Table 4.5 (O/WO~ 1.25 rx 2~/~2). The lower bulge associated with this region
rx
corresponds to a higher-k primary region associated with the third mode. The lower
simple resonance region is associated mainly with secondary resonance in the second
mode (k = 2), while the uppermost region is also secondary, but associated with the third
mode. The combination resonances at the bottom of Figure 4.29(a) involve the first and
second (and perhaps other) modes of the system, while the upper region is associated with
the second and third modes. In both cases the combination resonances appear to involve
the differences, rather than the sums, of the natural frequencies; this is in agreement
with some results obtained for columns subjected to periodic follower loads (Iwatsubo
etal. 1974).
Calculations for uo = 6.0 show similar parametric resonances as in Figure 4.29(a), but
smaller. Furthermore, the upper combination region disappears altogether. Calculations
for uo = 5.5 show that only simple parametric resonances survive, and for uo 5 4 all
resonances vanish.