
Page 382 - Fluid-Structure Interactions Slender Structure and Axial Flow (Volume 1)
P. 382
358 SLENDER STRUCTURES AND AXIAL FLOW
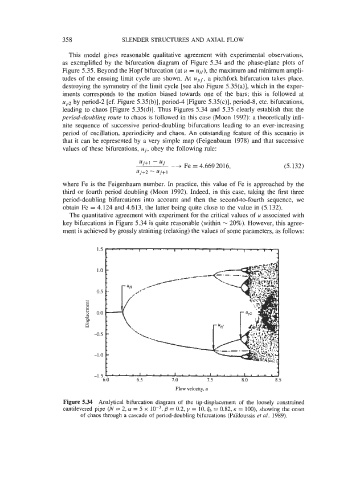
This model gives reasonable qualitative agreement with experimental observations,
as exemplified by the bifurcation diagram of Figure 5.34 and the phase-plane plots of
Figure 5.35. Beyond the Hopf bifurcation (at u = UH), the maximum and minimum ampli-
tudes of the ensuing limit cycle are shown. At upf, a pitchfork bifurcation takes place,
destroying the symmetry of the limit cycle [see also Figure 5.35(a)], which in the exper-
iments corresponds to the motion biased towards one of the bars; this is followed at
up2 by period-2 [cf. Figure 5.35(b)], period-4 [Figure 5.35(c)], period-8, etc. bifurcations,
leading to chaos [Figure 5.35(d)]. Thus Figures 5.34 and 5.35 clearly establish that the
period-doubling route to chaos is followed in this case (Moon 1992): a theoretically infi-
nite sequence of successive period-doubling bifurcations leading to an ever-increasing
period of oscillation, aperiodicity and chaos. An outstanding feature of this scenario is
that it can be represented by a very simple map (Feigenbaum 1978) and that successive
values of these bifurcations, uj, obey the following rule:
(5.132)
where Fe is the Feigenbaum number. In practice, this value of Fe is approached by the
third or fourth period doubling (Moon 1992). Indeed, in this case, taking the first three
period-doubling bifurcations into account and then the second-to-fourth sequence, we
obtain Fe = 4.124 and 4.613, the latter being quite close to the value in (5.132).
The quantitative agreement with experiment for the critical values of u associated with
key bifurcations in Figure 5.34 is quite reasonable (within - 20%). However, this agree-
ment is achieved by grossly straining (relaxing) the values of some parameters, as follows:
1 .o
0.5
-0.5
-1.0
-1.5
6.0 6.5 7.0 7.5 8.0 8.5
Flow velocity, u
Figure 5.34 Analytical bifurcation diagram of the tip-displacement of the loosely constrained
cantilevered pipe (N = 2, a! = 5 x B = 0.2, y = 10, tb = 0.82, K = loo), showing the onset
of chaos through a cascade of period-doubling bifurcations (Paldoussis et al. 1989).