Page 384 - Fluid-Structure Interactions Slender Structure and Axial Flow (Volume 1)
P. 384
360               SLENDER STRUCTURES AND AXIAL FLOW

                    another trajectory corresponding to different initial conditions. Then, defining the  vari-
                    ational vector function  u(t) = &(t) - @(t) such that  IIu(I <<  1, the  stability of  @(t) is
                    governed by the equation
                                                    u = Df(@)u,                         (5.133)

                    where Df(@) is the Jacobian matrix function for the vector field f(y) along @(t). Clearly,
                    if  &(t) approaches @(t), then u(t) will tend to zero; while if  it diverges away from it,
                    then u(s) will tend to grow. This may be expressed as
                                                    Ilu(t)ll - eUT.                     (5.134)

                    As the system is bounded, however, the exponential behaviour indicated by (5.134) cannot
                    continue indefinitely. Hence, in the computations the vector function u(t) is renormalized
                    from time to time and  the calculation process reinitialized in  that  sense. The  so-called
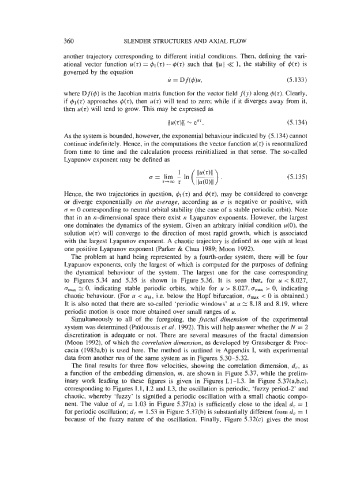
                    Lyapunov exponent may be defined as


                                                                                        (5.135)

                    Hence, the two trajectories in question, @I  (t) and #(t), may be considered to converge
                    or  diverge exponentially on  the  average, according as  CJ  is  negative  or positive,  with
                    CJ = 0 corresponding to neutral orbital stability (the case of  a stable periodic orbit). Note
                    that in an n-dimensional  space there exist n  Lyapunov exponents. However, the largest
                    one dominates the dynamics of  the system. Given an arbitrary initial condition u(O), the
                    solution u(t) will  converge to  the  direction of  most  rapid  growth, which is  associated
                    with the largest Lyapunov exponent. A chaotic trajectory is defined as one with at least
                    one positive Lyapunov exponent (Parker & Chua 1989; Moon  1992).
                      The problem at hand  being represented by  a fourth-order system, there will be  four
                    Lyapunov exponents, only the largest of  which is computed for the purposes of  defining
                    the  dynamical  behaviour  of  the  system.  The  largest  one  for  the  case  corresponding
                    to  Figures 5.34  and  5.35  is  shown  in  Figure 5.36.  It  is  seen  that,  for  u  i 8.027,
                    CJ,,   2: 0,  indicating  stable  periodic  orbits,  while  for  u > 8.027, a,,   > 0,  indicating
                    chaotic behaviour. (For u < u~, i.e. below  the Hopf bifurcation, amax  < 0 is obtained.)
                    It is also noted that there are so-called ‘periodic windows’ at u 2r: 8.18 and 8.19, where
                    periodic motion is once more obtained over small ranges of u.
                      Simultaneously  to  all  of  the  foregoing,  the fractal  dimension  of  the  experimental
                    system was determined (Paldoussis et al. 1992). This will help answer whether the N  = 2
                    discretization is  adequate or  not.  There  are  several measures  of  the  fractal  dimension
                     (Moon  1992), of which the correlation dimension, as developed by Grassberger & Proc-
                    cacia (1983a,b) is used here. The method  is  outlined in  Appendix I, with  experimental
                    data from another run of the same system as in Figures 5.30-5.32.
                      The final results for three flow  velocities, showing the correlation dimension, d,,  as
                    a function of the embedding dimension, m, are shown in Figure 5.37, while the prelim-
                    inary  work  leading  to  these  figures is  given  in  Figures 1.1-1.3.  In  Figure 5.37(a,b,c),
                    corresponding to Figures 1.1, 1.2 and 1.3, the oscillation is periodic, ‘fuzzy period-2’ and
                    chaotic, whereby  ‘fuzzy’ is signified a periodic oscillation with a small chaotic compo-
                    nent. The value of  d, = 1.03 in  Figure 5.37(a) is  sufficiently close to the ideal d, = 1
                    for periodic oscillation; d, = 1.53 in Figure 5.37(b) is substantially different from d, = 1
                    because  of  the  fuzzy  nature  of  the  oscillation. Finally,  Figure 5.32(c) gives  the  most

