
Page 387 - Fluid-Structure Interactions Slender Structure and Axial Flow (Volume 1)
P. 387
PIPES CONVEYING FLUID: NONLINEAR AND CHAOTIC DYNAMICS 363
Displacement
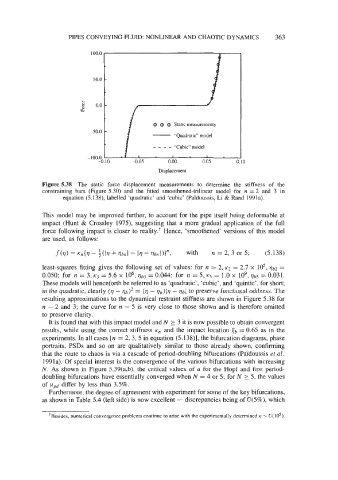
Figure 5.38 The static force-displacement measurements to determine the stiffness of the
constraining bars (Figure 5.30) and the fitted smoothened-trilinear model for n = 2 and 3 in
equation (5.138), labelled ‘quadratic’ and ‘cubic’ (PaYdoussis, Li & Rand 1991a).
This model may be improved further, to account for the pipe itself being deformable at
impact (Hunt & Crossley 1975), suggesting that a more gradual application of the full
force following impact is closer to reality.? Hence, ‘smoothened‘ versions of this model
are used, as follows:
f(V) = Kn{V - ;(I17 + VbnI - 1’1 - qbnl)}n, with Iz = 2, 3 or 5; (5.138)
least-squares fitting gives the following set of values: for n = 2, KZ = 2.7 x io5, Vb2 =
0.050; for Iz = 3, Kj = 5.6 X lo6, qb3 = 0.044; for n = 5, K5 = 1.0 X lo9, qb5 = 0.031.
These models will henceforth be referred to as ‘quadratic’, ‘cubic’, and ‘quintic’, for short;
in the quadratic, clearly (q - qb)’ = (q - Ijlb)lq - qbj to preserve functional oddness. The
resulting approximations to the dynamical restraint stiffness are shown in Figure 5.38 for
IZ = 2 and 3; the curve for n = 5 is very close to those shown and is therefore omitted
to preserve clarity.
It is found that with this impact model and N 2 3 it is now possible to obtain convergent
results, while using the correct stiffness K, and the impact location ct, = 0.65 as in the
experiments. In all cases [n = 2, 3, 5 in equation (5.138)], the bifurcation diagrams, phase
portraits, PSDs and so on are qualitatively similar to those already shown, confirming
that the route to chaos is via a cascade of period-doubling bifurcations (Paldoussis et al.
1991a). Of special interest is the convergence of the various bifurcations with increasing
N. As shown in Figure 5.39(a,b), the critical values of u for the Hopf and first period-
doubling bifurcations have essentially converged when N = 4 or 5; for N > 5, the values
of Upd differ by less than 3.5%.
Furthermore, the degree of agreement with experiment for some of the key bifurcations,
as shown in Table 5.4 (left side) is now excellent - discrepancies being of 0(5%), which
~~
‘Besides, numerical convergence problems continue to arise with the experimentally determined K - O(105).