
Page 336 - T. Anderson-Fracture Mechanics - Fundamentals and Applns.-CRC (2005)
P. 336
1656_C007.fm Page 316 Monday, May 23, 2005 5:54 PM
316 Fracture Mechanics: Fundamentals and Applications
modification would eliminate the size effect illustrated in Figure 7.16 and Figure 7.17, Wallin
argues that the restriction on P max /P in Equation (7.2c) would no longer be necessary.
Q
7.3 K-R CURVE TESTING
As discussed in the previous section, materials that fail by microvoid coalescence usually exhibit
a rising R curve. The ASTM E 399 test method measures a single point on the R curve. This method
contains an inherent size dependence on apparent toughness because the point on the R curve at
which K is defined is a function of the ligament length, as Figure 7.17 illustrates.
Q
An alternative to measuring a single toughness value is determining the entire R curve for
materials that exhibit ductile crack extension. The ASTM Standard E 561 [14] outlines a procedure
for determining K vs. crack growth curves in such materials. Unlike ASTM E 399, the K-R standard
does not contain a minimum thickness requirement, and thus can be applied to thin sheets. This
standard, however, is appropriate only when the plastic zone is small compared to the in-plane
dimensions of the test specimen. This test method is often applied to high-strength sheet materials.
As Figure 7.15 illustrates, thin sheets generally have a steeper R curve than thick sections
because the slant fracture morphology dominates in the former. There is a common misconception
about the effect of section thickness on the shape of the R curve. A number of published articles
and textbooks imply that thick sections, corresponding to so-called plane strain fracture, exhibit a
single value of fracture toughness (K ), while the same material in a thin section displays a rising
Ic
R curve. The latter is often mistakenly referred to as ‘‘plane stress fracture.’’ (Refer to Section 2.10
for a detailed discussion of the fallacies of the traditional ‘‘plane stress’’ and ‘‘plane strain’’
descriptions of crack-tip conditions.) The section thickness has an effect on the crack-tip stress
state and the fracture morphology, which in turn affects the slope of the R curve (Figure 7.15).
However, a material that fails by microvoid coalescence usually has a rising R curve even for flat
fracture under predominately plane strain conditions. The only instance where a thin section might
exhibit a rising R curve while a thick section of the same material has a flat R curve (and a single-
valued toughness) is where the difference in crack-tip triaxiality causes a fracture mode change
from ductile tearing to cleavage in thin and thick sections, respectively.
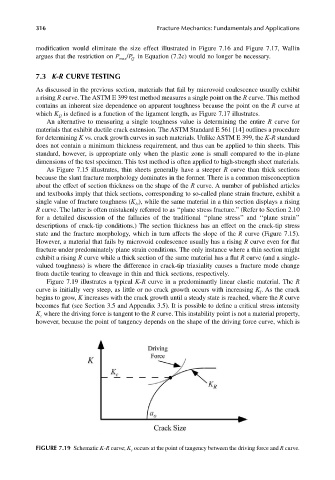
Figure 7.19 illustrates a typical K-R curve in a predominantly linear elastic material. The R
curve is initially very steep, as little or no crack growth occurs with increasing K . As the crack
I
begins to grow, K increases with the crack growth until a steady state is reached, where the R curve
becomes flat (see Section 3.5 and Appendix 3.5). It is possible to define a critical stress intensity
K where the driving force is tangent to the R curve. This instability point is not a material property,
c
however, because the point of tangency depends on the shape of the driving force curve, which is
FIGURE 7.19 Schematic K-R curve; K c occurs at the point of tangency between the driving force and R curve.