
Page 333 - T. Anderson-Fracture Mechanics - Fundamentals and Applns.-CRC (2005)
P. 333
1656_C007.fm Page 313 Monday, May 23, 2005 5:54 PM
Fracture Toughness Testing of Metals 313
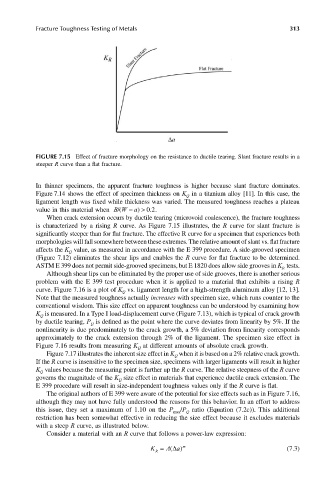
FIGURE 7.15 Effect of fracture morphology on the resistance to ductile tearing. Slant fracture results in a
steeper R curve than a flat fracture.
In thinner specimens, the apparent fracture toughness is higher because slant fracture dominates.
Figure 7.14 shows the effect of specimen thickness on K in a titanium alloy [11]. In this case, the
Q
ligament length was fixed while thickness was varied. The measured toughness reaches a plateau
value in this material when BW − /( a) > . 02 .
When crack extension occurs by ductile tearing (microvoid coalescence), the fracture toughness
is characterized by a rising R curve. As Figure 7.15 illustrates, the R curve for slant fracture is
significantly steeper than for flat fracture. The effective R curve for a specimen that experiences both
morphologies will fall somewhere between these extremes. The relative amount of slant vs. flat fracture
affects the K value, as measured in accordance with the E 399 procedure. A side-grooved specimen
Q
(Figure 7.12) eliminates the shear lips and enables the R curve for flat fracture to be determined.
ASTM E 399 does not permit side-grooved specimens, but E 1820 does allow side grooves in K tests.
Ic
Although shear lips can be eliminated by the proper use of side grooves, there is another serious
problem with the E 399 test procedure when it is applied to a material that exhibits a rising R
curve. Figure 7.16 is a plot of K vs. ligament length for a high-strength aluminum alloy [12, 13].
Q
Note that the measured toughness actually increases with specimen size, which runs counter to the
conventional wisdom. This size effect on apparent toughness can be understood by examining how
K is measured. In a Type I load-displacement curve (Figure 7.13), which is typical of crack growth
Q
by ductile tearing, P is defined as the point where the curve deviates from linearity by 5%. If the
Q
nonlinearity is due predominately to the crack growth, a 5% deviation from linearity corresponds
approximately to the crack extension through 2% of the ligament. The specimen size effect in
Figure 7.16 results from measuring K at different amounts of absolute crack growth.
Q
Figure 7.17 illustrates the inherent size effect in K when it is based on a 2% relative crack growth.
Q
If the R curve is insensitive to the specimen size, specimens with larger ligaments will result in higher
K values because the measuring point is further up the R curve. The relative steepness of the R curve
Q
governs the magnitude of the K size effect in materials that experience ductile crack extension. The
Q
E 399 procedure will result in size-independent toughness values only if the R curve is flat.
The original authors of E 399 were aware of the potential for size effects such as in Figure 7.16,
although they may not have fully understood the reasons for this behavior. In an effort to address
this issue, they set a maximum of 1.10 on the P max /P ratio (Equation (7.2c)). This additional
Q
restriction has been somewhat effective in reducing the size effect because it excludes materials
with a steep R curve, as illustrated below.
Consider a material with an R curve that follows a power-law expression:
K R A = (∆ a ) m (7.3)