
Page 345 - T. Anderson-Fracture Mechanics - Fundamentals and Applns.-CRC (2005)
P. 345
1656_C007.fm Page 325 Monday, May 23, 2005 5:54 PM
Fracture Toughness Testing of Metals 325
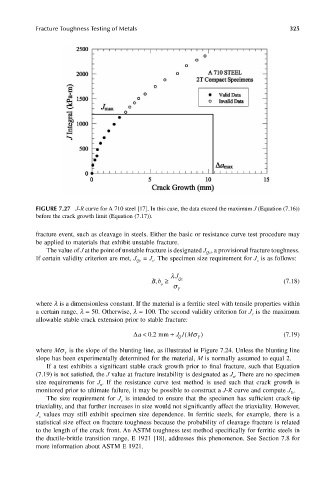
FIGURE 7.27 J-R curve for A 710 steel [17]. In this case, the data exceed the maximum J (Equation (7.16))
before the crack growth limit (Equation (7.17)).
fracture event, such as cleavage in steels. Either the basic or resistance curve test procedure may
be applied to materials that exhibit unstable fracture.
The value of J at the point of unstable fracture is designated J , a provisional fracture toughness.
Qc
If certain validity criterion are met, J = J . The specimen size requirement for J is as follows:
c
Qc
c
λ J
Bb ≥ σ Y Qc (7.18)
,
o
where λ is a dimensionless constant. If the material is a ferritic steel with tensile properties within
a certain range, λ = 50. Otherwise, λ = 100. The second validity criterion for J is the maximum
c
allowable stable crack extension prior to stable fracture:
∆ < a + J 02 . mm Q /( σ Y ) (7.19)
M
where Mσ Y is the slope of the blunting line, as illustrated in Figure 7.24. Unless the blunting line
slope has been experimentally determined for the material, M is normally assumed to equal 2.
If a test exhibits a significant stable crack growth prior to final fracture, such that Equation
(7.19) is not satisfied, the J value at fracture instability is designated as J . There are no specimen
u
size requirements for J . If the resistance curve test method is used such that crack growth is
u
monitored prior to ultimate failure, it may be possible to construct a J-R curve and compute J .
Ic
The size requirement for J is intended to ensure that the specimen has sufficient crack-tip
c
triaxiality, and that further increases in size would not significantly affect the triaxiality. However,
J values may still exhibit specimen size dependence. In ferritic steels, for example, there is a
c
statistical size effect on fracture toughness because the probability of cleavage fracture is related
to the length of the crack front. An ASTM toughness test method specifically for ferritic steels in
the ductile-brittle transition range, E 1921 [18], addresses this phenomenon. See Section 7.8 for
more information about ASTM E 1921.