
Page 348 - T. Anderson-Fracture Mechanics - Fundamentals and Applns.-CRC (2005)
P. 348
1656_C007.fm Page 328 Monday, May 23, 2005 5:54 PM
328 Fracture Mechanics: Fundamentals and Applications
the exclusion lines, and a 0.2-mm offset line with a slope of M . The size requirement for a valid
δ
d is given by
Ic
b ≥ 35δ Q (7.25)
o
The basic procedure can be used to measure d , but multiple specimens are required to define a
Ic
d-R curve. ASTM E 1290 does not provide a procedure to measure d .
Ic
For tests that terminate in unstable fracture, such as cleavage in ferritic steels, the symbols d c
and d are assigned to the resulting CTOD values. The appropriate symbol depends on whether or
u
not the fracture instability was preceded by significant stable crack extension, as is the case with
J and J measurements in E 1820. When assessing toughness in accordance to ASTM E 1820, the
u
c
d label applies when ∆a + 02 . mm δ Qu/ M ≥ δ . In ASTM E 1290, fracture instability toughness is
u
designated as d when ∆a ≥ 02. mm . When ∆ < a + 02 . mm δ Qu/ M δ , ASTM E 1820 imposes the
u
following size requirement on d :
c
Bb ≥ 300δ Q c (7.26)
,
o
This size requirement is approximately two to four times more stringent than the requirement on
J (Equation (7.19)). It is likely that a future revision of ASTM E 1820 will relax the CTOD size
c
requirement to make it consistent with the J size requirement. ASTM E 1290 does not have a size
c
requirement on d .
c
When applying the basic test method to a ductile material that does not exhibit fracture instability,
it is usually not possible to infer a d-R curve or d , but the value of CTOD at the maximum load
Ic
plateau, d , can be reported. This maximum load point is the result of competition between strain
m
hardening, which causes the load to increase with deformation, and ductile crack growth, which
reduces the cross section of the specimen. The CTOD at maximum load in a ductile material gives
a relative indication of toughness, but d values are highly dependent on specimen size.
m
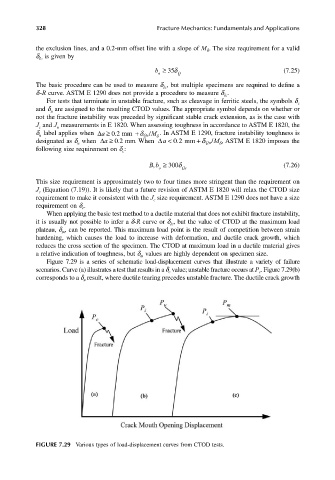
Figure 7.29 is a series of schematic load-displacement curves that illustrate a variety of failure
scenarios. Curve (a) illustrates a test that results in a d value; unstable fracture occurs at P . Figure 7.29(b)
c
c
corresponds to a d result, where ductile tearing precedes unstable fracture. The ductile crack growth
u
FIGURE 7.29 Various types of load-displacement curves from CTOD tests.