
Page 353 - T. Anderson-Fracture Mechanics - Fundamentals and Applns.-CRC (2005)
P. 353
1656_C007.fm Page 333 Monday, May 23, 2005 5:54 PM
Fracture Toughness Testing of Metals 333
FIGURE 7.32 Side-grooved compact crack-arrest specimen. Taken from E 1221-96, ‘‘Standard Method for
Determining Plane-Strain Crack-Arrest Toughness, K Ia , of Ferritic Steels.’’ American Society for Testing and
Materials, Philadelphia, PA, 1996 (Reapproved 2002).
total displacement when stress intensity is computed. The specimen is reloaded to a somewhat
higher displacement and then unloaded; this process continues until fracture initiates. The zero load
offset displacements that occur after the first cycle can be considered to be due to notch-tip plasticity.
The correct way to treat this displacement component in K calculations is unclear at present. Once
the crack propagates through the plastic zone, the plastic displacement is largely recovered (i.e.,
converted into an elastic displacement), and thus may contribute to the driving force. It is not known
whether or not there is sufficient time for this displacement component to exert an influence on
the running crack. The ASTM standard takes the middle ground on this question, and requires that
half of the plastic offset be included in the stress-intensity calculations.
After the test, the specimen should be heat tinted at 250 –350°C for 10–90 min to mark the
crack propagation. When the specimen is broken open, the arrested crack length can then be
measured on the fracture surface. The critical stress intensity at initiation K is computed from the
o
initial crack size and the critical clip-gage displacement. The provisional arrest toughness K is
a
calculated from the final crack size, assuming a constant displacement. These calculations assume
quasistatic conditions. As discussed in Chapter 4, this assumption can lead to underestimates of
arrest toughness. The ASTM standard, however, cites experimental evidence that implies that the
errors introduced by a quasistatic assumption are small in this case [32,33].
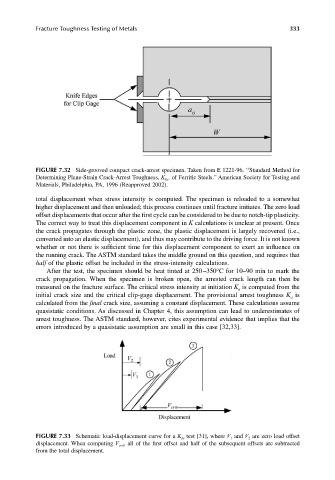
FIGURE 7.33 Schematic load-displacement curve for a K Ia test [31], where V 1 and V 2 are zero load offset
displacement. When computing V crit , all of the first offset and half of the subsequent offsets are subtracted
from the total displacement.