
Page 358 - T. Anderson-Fracture Mechanics - Fundamentals and Applns.-CRC (2005)
P. 358
1656_C007.fm Page 338 Monday, May 23, 2005 5:54 PM
338 Fracture Mechanics: Fundamentals and Applications
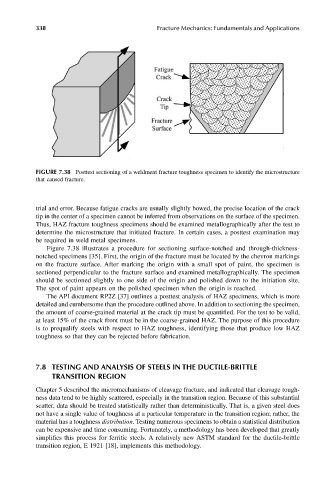
FIGURE 7.38 Posttest sectioning of a weldment fracture toughness specimen to identify the microstructure
that caused fracture.
trial and error. Because fatigue cracks are usually slightly bowed, the precise location of the crack
tip in the center of a specimen cannot be inferred from observations on the surface of the specimen.
Thus, HAZ fracture toughness specimens should be examined metallographically after the test to
determine the microstructure that initiated fracture. In certain cases, a posttest examination may
be required in weld metal specimens.
Figure 7.38 illustrates a procedure for sectioning surface-notched and through-thickness-
notched specimens [35]. First, the origin of the fracture must be located by the chevron markings
on the fracture surface. After marking the origin with a small spot of paint, the specimen is
sectioned perpendicular to the fracture surface and examined metallographically. The specimen
should be sectioned slightly to one side of the origin and polished down to the initiation site.
The spot of paint appears on the polished specimen when the origin is reached.
The API document RP2Z [37] outlines a posttest analysis of HAZ specimens, which is more
detailed and cumbersome than the procedure outlined above. In addition to sectioning the specimen,
the amount of coarse-grained material at the crack tip must be quantified. For the test to be valid,
at least 15% of the crack front must be in the coarse-grained HAZ. The purpose of this procedure
is to prequalify steels with respect to HAZ toughness, identifying those that produce low HAZ
toughness so that they can be rejected before fabrication.
7.8 TESTING AND ANALYSIS OF STEELS IN THE DUCTILE-BRITTLE
TRANSITION REGION
Chapter 5 described the micromechanisms of cleavage fracture, and indicated that cleavage tough-
ness data tend to be highly scattered, especially in the transition region. Because of this substantial
scatter, data should be treated statistically rather than deterministically. That is, a given steel does
not have a single value of toughness at a particular temperature in the transition region; rather, the
material has a toughness distribution. Testing numerous specimens to obtain a statistical distribution
can be expensive and time consuming. Fortunately, a methodology has been developed that greatly
simplifies this process for ferritic steels. A relatively new ASTM standard for the ductile-brittle
transition region, E 1921 [18], implements this methodology.