
Page 360 - T. Anderson-Fracture Mechanics - Fundamentals and Applns.-CRC (2005)
P. 360
1656_C007.fm Page 340 Monday, May 23, 2005 5:54 PM
340 Fracture Mechanics: Fundamentals and Applications
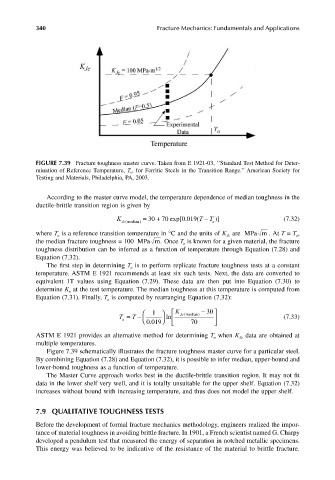
FIGURE 7.39 Fracture toughness master curve. Taken from E 1921-03, ‘‘Standard Test Method for Deter-
mination of Reference Temperature, T o , for Ferritic Steels in the Transition Range.’’ American Society for
Testing and Materials, Philadelphia, PA, 2003.
According to the master curve model, the temperature dependence of median toughness in the
ductile-brittle transition region is given by
K = + 30 70 exp[ .019 ( − T T )] (7.32)
0
Jc(median ) o
where T is a reference transition temperature in °C and the units of K are MPa m . At T = T ,
o
o
Jc
the median fracture toughness = 100 MPa m . Once T is known for a given material, the fracture
o
toughness distribution can be inferred as a function of temperature through Equation (7.28) and
Equation (7.32).
The first step in determining T is to perform replicate fracture toughness tests at a constant
o
temperature. ASTM E 1921 recommends at least six such tests. Next, the data are converted to
equivalent 1T values using Equation (7.29). These data are then put into Equation (7.30) to
determine K at the test temperature. The median toughness at this temperature is computed from
o
Equation (7.31). Finally, T is computed by rearranging Equation (7.32):
o
T T = − 1 ln K Jc(median ) − 30 (7.33)
o
0 019. 70
ASTM E 1921 provides an alternative method for determining T when K data are obtained at
Jc
o
multiple temperatures.
Figure 7.39 schematically illustrates the fracture toughness master curve for a particular steel.
By combining Equation (7.28) and Equation (7.32), it is possible to infer median, upper-bound and
lower-bound toughness as a function of temperature.
The Master Curve approach works best in the ductile-brittle transition region. It may not fit
data in the lower shelf very well, and it is totally unsuitable for the upper shelf. Equation (7.32)
increases without bound with increasing temperature, and thus does not model the upper shelf.
7.9 QUALITATIVE TOUGHNESS TESTS
Before the development of formal fracture mechanics methodology, engineers realized the impor-
tance of material toughness in avoiding brittle fracture. In 1901, a French scientist named G. Charpy
developed a pendulum test that measured the energy of separation in notched metallic specimens.
This energy was believed to be indicative of the resistance of the material to brittle fracture.