
Page 357 - T. Anderson-Fracture Mechanics - Fundamentals and Applns.-CRC (2005)
P. 357
1656_C007.fm Page 337 Monday, May 23, 2005 5:54 PM
Fracture Toughness Testing of Metals 337
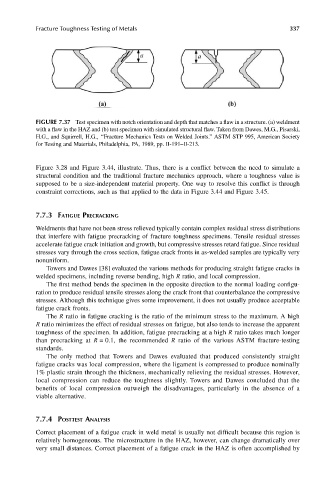
FIGURE 7.37 Test specimen with notch orientation and depth that matches a flaw in a structure. (a) weldment
with a flaw in the HAZ and (b) test specimen with simulated structural flaw. Taken from Dawes, M.G., Pisarski,
H.G., and Squirrell, H.G., ‘‘Fracture Mechanics Tests on Welded Joints.’’ ASTM STP 995, American Society
for Testing and Materials, Philadelphia, PA, 1989, pp. II-191–II-213.
Figure 3.28 and Figure 3.44, illustrate. Thus, there is a conflict between the need to simulate a
structural condition and the traditional fracture mechanics approach, where a toughness value is
supposed to be a size-independent material property. One way to resolve this conflict is through
constraint corrections, such as that applied to the data in Figure 3.44 and Figure 3.45.
7.7.3 FATIGUE PRECRACKING
Weldments that have not been stress relieved typically contain complex residual stress distributions
that interfere with fatigue precracking of fracture toughness specimens. Tensile residual stresses
accelerate fatigue crack initiation and growth, but compressive stresses retard fatigue. Since residual
stresses vary through the cross section, fatigue crack fronts in as-welded samples are typically very
nonuniform.
Towers and Dawes [38] evaluated the various methods for producing straight fatigue cracks in
welded specimens, including reverse bending, high R ratio, and local compression.
The first method bends the specimen in the opposite direction to the normal loading configu-
ration to produce residual tensile stresses along the crack front that counterbalance the compressive
stresses. Although this technique gives some improvement, it does not usually produce acceptable
fatigue crack fronts.
The R ratio in fatigue cracking is the ratio of the minimum stress to the maximum. A high
R ratio minimizes the effect of residual stresses on fatigue, but also tends to increase the apparent
toughness of the specimen. In addition, fatigue precracking at a high R ratio takes much longer
than precracking at R = 0.1, the recommended R ratio of the various ASTM fracture-testing
standards.
The only method that Towers and Dawes evaluated that produced consistently straight
fatigue cracks was local compression, where the ligament is compressed to produce nominally
1% plastic strain through the thickness, mechanically relieving the residual stresses. However,
local compression can reduce the toughness slightly. Towers and Dawes concluded that the
benefits of local compression outweigh the disadvantages, particularly in the absence of a
viable alternative.
7.7.4 POSTTEST ANALYSIS
Correct placement of a fatigue crack in weld metal is usually not difficult because this region is
relatively homogeneous. The microstructure in the HAZ, however, can change dramatically over
very small distances. Correct placement of a fatigue crack in the HAZ is often accomplished by