
Page 399 - T. Anderson-Fracture Mechanics - Fundamentals and Applns.-CRC (2005)
P. 399
1656_C008.fm Page 379 Monday, May 23, 2005 5:59 PM
Fracture Testing of Nonmetals 379
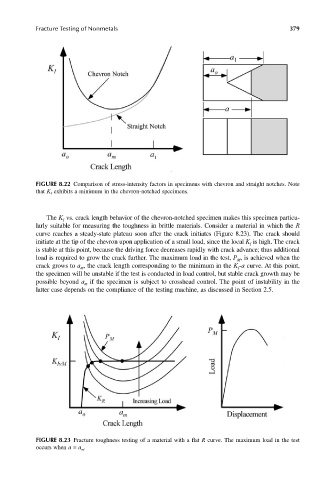
FIGURE 8.22 Comparison of stress-intensity factors in specimens with chevron and straight notches. Note
that K I exhibits a minimum in the chevron-notched specimens.
The K vs. crack length behavior of the chevron-notched specimen makes this specimen particu-
I
larly suitable for measuring the toughness in brittle materials. Consider a material in which the R
curve reaches a steady-state plateau soon after the crack initiates (Figure 8.23). The crack should
initiate at the tip of the chevron upon application of a small load, since the local K is high. The crack
I
is stable at this point, because the driving force decreases rapidly with crack advance; thus additional
load is required to grow the crack further. The maximum load in the test, P , is achieved when the
M
crack grows to a , the crack length corresponding to the minimum in the K -a curve. At this point,
I
m
the specimen will be unstable if the test is conducted in load control, but stable crack growth may be
possible beyond a if the specimen is subject to crosshead control. The point of instability in the
m
latter case depends on the compliance of the testing machine, as discussed in Section 2.5.
FIGURE 8.23 Fracture toughness testing of a material with a flat R curve. The maximum load in the test
occurs when a = a m .