
Page 397 - T. Anderson-Fracture Mechanics - Fundamentals and Applns.-CRC (2005)
P. 397
1656_C008.fm Page 377 Monday, May 23, 2005 5:59 PM
Fracture Testing of Nonmetals 377
FIGURE 8.19 Schematic load-displacement curve for a delamination toughness measurement.
can be resolved into Mode I and Mode II components as follows:
P I P = || (8.39a)
L
P
|| P − | |
P = U L (8.39b)
II
2
where P and P are the upper and lower loads, respectively. The components of G can be computed
L
U
by inserting P and P into Equation (8.36) and Equation (8.38). Recall from Chapter 2 that Mode I
I
II
and Mode II components of energy release rate are additive.
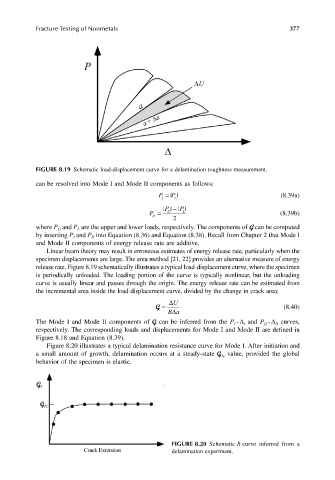
Linear beam theory may result in erroneous estimates of energy release rate, particularly when the
specimen displacements are large. The area method [21, 22] provides an alternative measure of energy
release rate. Figure 8.19 schematically illustrates a typical load-displacement curve, where the specimen
is periodically unloaded. The loading portion of the curve is typically nonlinear, but the unloading
curve is usually linear and passes through the origin. The energy release rate can be estimated from
the incremental area inside the load-displacement curve, divided by the change in crack area:
∆U
G = (8.40)
Ba
∆
The Mode I and Mode II components of G can be inferred from the P - ∆ and P - ∆ curves,
II
I
I
II
respectively. The corresponding loads and displacements for Mode I and Mode II are defined in
Figure 8.18 and Equation (8.39).
Figure 8.20 illustrates a typical delamination resistance curve for Mode I. After initiation and
a small amount of growth, delamination occurs at a steady-state G value, provided the global
Ic
behavior of the specimen is elastic.
FIGURE 8.20 Schematic R curve inferred from a
delamination experiment.