
Page 88 - T. Anderson-Fracture Mechanics - Fundamentals and Applns.-CRC (2005)
P. 88
1656_C02.fm Page 68 Thursday, April 14, 2005 6:28 PM
68 Fracture Mechanics: Fundamentals and Applications
(a) (b)
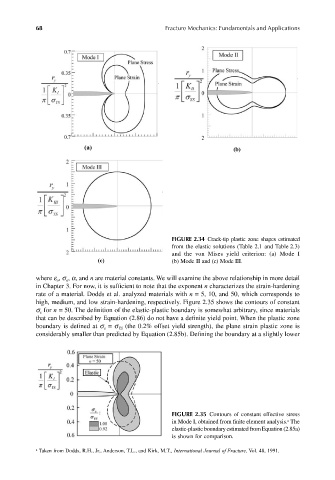
FIGURE 2.34 Crack-tip plastic zone shapes estimated
from the elastic solutions (Table 2.1 and Table 2.3)
and the von Mises yield criterion: (a) Mode I
(c) (b) Mode II and (c) Mode III.
where ε , σ , α, and n are material constants. We will examine the above relationship in more detail
o
o
in Chapter 3. For now, it is sufficient to note that the exponent n characterizes the strain-hardening
rate of a material. Dodds et al. analyzed materials with n = 5, 10, and 50, which corresponds to
high, medium, and low strain-hardening, respectively. Figure 2.35 shows the contours of constant
σ for n = 50. The definition of the elastic-plastic boundary is somewhat arbitrary, since materials
e
that can be described by Equation (2.86) do not have a definite yield point. When the plastic zone
boundary is defined at σ = σ (the 0.2% offset yield strength), the plane strain plastic zone is
e
YS
considerably smaller than predicted by Equation (2.85b). Defining the boundary at a slightly lower
FIGURE 2.35 Contours of constant effective stress
in Mode I, obtained from finite element analysis. The
a
elastic-plastic boundary estimated from Equation (2.85a)
is shown for comparison.
a Taken from Dodds, R.H., Jr., Anderson, T.L., and Kirk, M.T., International Journal of Fracture, Vol. 48, 1991.