Page 144 - Fundamentals of Communications Systems
P. 144

4.20  Chapter Four

                                              xt ()
                                               Q

                                                045exp j [  77°]
                                                .
                                                 • Yellow
                              0 59exp j [  151°]
                               .
                              • Green                  064exp j [  137°. ]
                                                        .
                                                           • Red
                            0 64exp j [  193°]                     xt()
                             .
                                                                    I
                             • Cyan
                                                       0 59exp j [  331°]
                                                        .
                                                         • Magenta
                                       0 45exp j [  257°]
                                        .
                                        • Blue


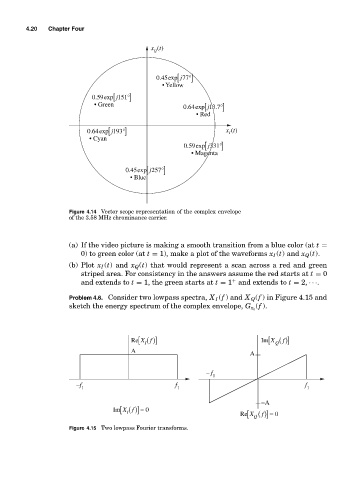
                       Figure 4.14 Vector scope representation of the complex envelope
                       of the 3.58 MHz chrominance carrier.


                       (a) If the video picture is making a smooth transition from a blue color (at t =
                           0) to green color (at t = 1), make a plot of the waveforms x I (t) and x Q (t).
                       (b) Plot x I (t) and x Q (t) that would represent a scan across a red and green
                           striped area. For consistency in the answers assume the red starts at t = 0
                           and extends to t = 1, the green starts at t = 1 and extends to t = 2, ···.
                                                                     +
                       Problem 4.6. Consider two lowpass spectra, X I (f ) and X Q (f ) in Figure 4.15 and
                                                                           (f ).
                       sketch the energy spectrum of the complex envelope, G x z


                                            I [
                                         Re Xf ()]                           Im X ()]
                                                                               [
                                                                                   f
                                                                                 Q
                                        A
                                                                          A
                                                             − f
                                                               1
                         −f                          f                                   f
                           1                         1                                   1
                                       I [                                   −A
                                                                         [
                                    Im Xf ()] = 0                      Re X ()] = 0
                                                                             f
                                                                           Q
                       Figure 4.15 Two lowpass Fourier transforms.
   139   140   141   142   143   144   145   146   147   148   149