
Page 167 - Fundamentals of Communications Systems
P. 167
Analog Communications Basics 5.7
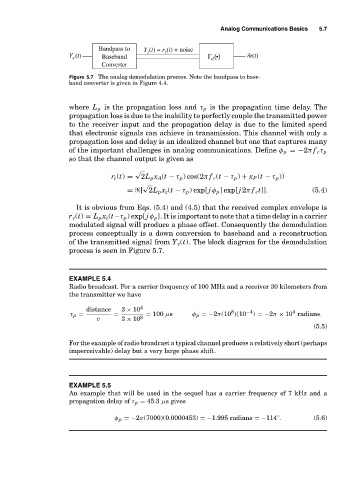
Bandpass to Y (t) = r (t) + noise
z
z
Y (t) Baseband Γ • () mˆ (t)
c
d
Converter
Figure 5.7 The analog demodulation process. Note the bandpass to base-
band converter is given in Figure 4.4.
where L p is the propagation loss and τ p is the propagation time delay. The
propagation loss is due to the inability to perfectly couple the transmitted power
to the receiver input and the propagation delay is due to the limited speed
that electronic signals can achieve in transmission. This channel with only a
propagation loss and delay is an idealized channel but one that captures many
of the important challenges in analog communications. Define φ p =−2π f c τ p
so that the channel output is given as
√
r c (t) = 2L p x A (t − τ p ) cos(2π f c (t − τ p ) + x P (t − τ p ))
√
=
[ 2L p x z (t − τ p ) exp[ j φ p ] exp[ j 2π f c t]]. (5.4)
It is obvious from Eqs. (5.4) and (4.5) that the received complex envelope is
r z (t) = L p x z (t−τ p ) exp[ j φ p ]. It is important to note that a time delay in a carrier
modulated signal will produce a phase offset. Consequently the demodulation
process conceptually is a down conversion to baseband and a reconstruction
of the transmitted signal from Y z (t). The block diagram for the demodulation
process is seen in Figure 5.7.
EXAMPLE 5.4
Radio broadcast. For a carrier frequency of 100 MHz and a receiver 30 kilometers from
the transmitter we have
distance 3 × 10 4 8 −4 4
τ p = = 8 = 100 µs φ p =−2π(10 )(10 ) =−2π × 10 radians.
c 3 × 10
(5.5)
For the example of radio broadcast a typical channel produces a relatively short (perhaps
imperceivable) delay but a very large phase shift.
EXAMPLE 5.5
An example that will be used in the sequel has a carrier frequency of 7 kHz and a
propagation delay of τ p = 45.3 µs gives
φ p =−2π(7000)(0.0000453) =−1.995 radians =−114 . (5.6)
◦