
Page 185 - Fundamentals of Communications Systems
P. 185
Amplitude Modulation 6.7
The phase of y z (t) (in the absence of noise) will either take value of φ p (when
m(t) > 0) or φ p + π (when m(t) < 0). Squaring the signal gets rid of this
bi-modal phase characteristic as can be seen by examining the signal
2
2
2
v z (t) = (x z (t) exp[ j φ p ]) = A m (t) exp[ j 2φ p ] (6.7)
c
2
2
because A m (t) > 0 so the arg(v z (t)) = 2φ p . In Figure 6.7 the filtering, H z (f ),
c
is used to smooth the phase estimate in the presence of noise.
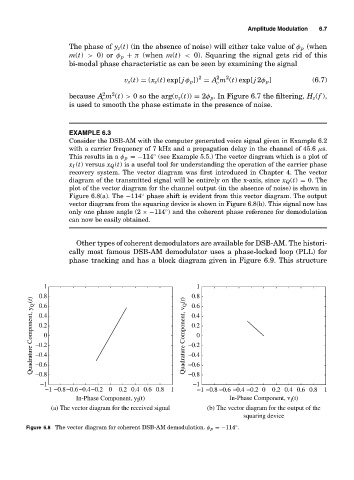
EXAMPLE 6.3
Consider the DSB-AM with the computer generated voice signal given in Example 6.2
with a carrier frequency of 7 kHz and a propagation delay in the channel of 45.6 µs.
This results in a φ p =−114 (see Example 5.5.) The vector diagram which is a plot of
◦
x I (t) versus x Q (t) is a useful tool for understanding the operation of the carrier phase
recovery system. The vector diagram was first introduced in Chapter 4. The vector
diagram of the transmitted signal will be entirely on the x-axis, since x Q (t) = 0. The
plot of the vector diagram for the channel output (in the absence of noise) is shown in
◦
Figure 6.8(a). The −114 phase shift is evident from this vector diagram. The output
vector diagram from the squaring device is shown in Figure 6.8(b). This signal now has
only one phase angle (2 ×−114 ) and the coherent phase reference for demodulation
◦
can now be easily obtained.
Other types of coherent demodulators are available for DSB-AM. The histori-
cally most famous DSB-AM demodulator uses a phase-locked loop (PLL) for
phase tracking and has a block diagram given in Figure 6.9. This structure
1 1
0.8 0.8
Quadrature Component, y Q (t) −0.2 0 Quadrature Component, v Q (t) −0.2 0
0.6
0.6
0.4
0.4
0.2
0.2
−0.4
−0.4
−0.6
−0.8
−0.8
−1
−1 −0.6
−1 −0.8−0.6−0.4−0.2 0 0.2 0.4 0.6 0.8 1 −1 −0.8 −0.6 −0.4 −0.2 0 0.2 0.4 0.6 0.8 1
In-Phase Component, y (t) In-Phase Component, v (t)
I
I
(a) The vector diagram for the received signal (b) The vector diagram for the output of the
squaring device
Figure 6.8 The vector diagram for coherent DSB-AM demodulation. φ p =−114 .
◦