Page 190 - Fundamentals of Communications Systems
P. 190

6.12  Chapter Six

              2                                           1
                                                        0.8
            1.5                                         0.6
                                                       G m (f)
              1                                         0.4
                                                        0.2
            0.5
                                                          0
              0                                           −30   −20  −10    0     10    20   30
                                                       0.25
           −0.5                                         0.2
                                                      G x c (f)  0.1
             −1                                        0.15
           −1.5
                                                       0.05
             −2                                           0
             0.081  0.083  0.085  0.087  0.089  0.091    −30   −20   −10     0    10    20   30
                            Time, t, sec                           Normalized Frequency, f/f m
                           (a) Time signal                           (b) Energy spectrum
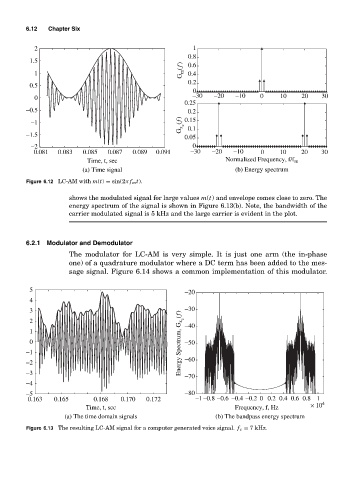
           Figure 6.12 LC-AM with m(t) = sin(2π f m t).

                       shows the modulated signal for large values m(t) and envelope comes close to zero. The
                       energy spectrum of the signal is shown in Figure 6.13(b). Note, the bandwidth of the
                       carrier modulated signal is 5 kHz and the large carrier is evident in the plot.


           6.2.1 Modulator and Demodulator
                       The modulator for LC-AM is very simple. It is just one arm (the in-phase
                       one) of a quadrature modulator where a DC term has been added to the mes-
                       sage signal. Figure 6.14 shows a common implementation of this modulator.

            5                                          −20
            4
            3                                          −30
            2                                          −40
            1
            0                                         Energy Spectrum, G x c (f)  −50
           −1
           −2                                          −60
           −3
                                                       −70
           −4
           −5                                          −80
            0.163  0.165      0.168   0.170  0.172        −1 −0.8 −0.6 −0.4 −0.2 0 0.2 0.4 0.6 0.8 1  4
                            Time, t, sec                             Frequency, f, Hz     × 10
                      (a) The time domain signals               (b) The bandpass energy spectrum
           Figure 6.13 The resulting LC-AM signal for a computer generated voice signal. f c = 7 kHz.
   185   186   187   188   189   190   191   192   193   194   195