Page 192 - Fundamentals of Communications Systems
P. 192

6.14  Chapter Six

                                 Envelope Detector

                       y t ()                                       A m t()
                        c
                                                                     0
                                                  DC Remover


                       Figure 6.16 Circuit implementation of an LC-AM demodulator.

                       phase shift induced by the propagation delay in the channel is entirely limited
                       to shifting the phase of the bandpass signal and has no impact on the amplitude
                       of bandpass signal.


                       EXAMPLE 6.6
                       Consider again affine modulation with
                                                   m(t) = β sin(2π f m t)
                       with
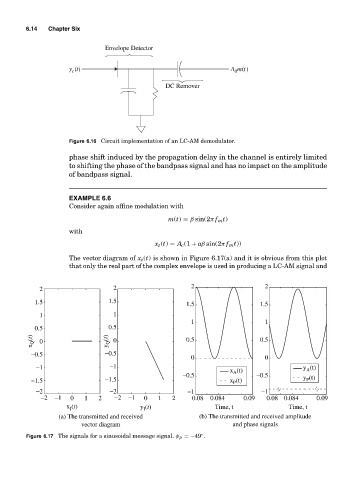
                                               x z (t) = A c (1 + aβ sin(2π f m t))
                       The vector diagram of x z (t) is shown in Figure 6.17(a) and it is obvious from this plot
                       that only the real part of the complex envelope is used in producing a LC-AM signal and


               2                    2                    2                    2
              1.5                 1.5                   1.5                 1.5
               1                    1
                                                         1                    1
              0.5                 0.5
             x Q (t)  0           y Q (t)  0            0.5                 0.5

             −0.5                −0.5
                                                         0                    0
              −1                   −1                               x (t)               y (t)
                                                                                         A
                                                       −0.5          A     −0.5
                                                                                         P
             −1.5                −1.5                               x (t)               y (t)
                                                                     P
              −2                   −2                   −1                   −1
               −2  −1   0   1  2    −2  −1  0   1   2    0.08  0.084    0.09  0.08 0.084    0.09
                       x (t)               y (t)                Time, t             Time, t
                       I
                                            I
                    (a) The transmitted and received       (b) The transmitted and received amplitude
                           vector diagram                            and phase signals
           Figure 6.17 The signals for a sinusoidal message signal. φ p =−49 .
                                                            ◦
   187   188   189   190   191   192   193   194   195   196   197