Page 199 - Fundamentals of Communications Systems
P. 199

Amplitude Modulation  6.21

             1                                          0.25
           0.8                                           0.2
           0.6                                         G m (f)  0.15
           0.4                                           0.1
                                                        0.05
           0.2                                            0
                                                          −30   −20   −10   0     10    20  30
             0
          −0.2                                          0.07
          −0.4                                          0.05
                                                       G x c (f)  0.03
          −0.6
          −0.8
                                                        0.01
            −1                                            0
            0.08   0.082  0.084   0.086  0.088  0.09      −30   −20   −10   0     10    20  30
                            Time, t, sec                           Normalized Frequency, f/f m
                           (a) Time signal                           (b) Energy spectrum
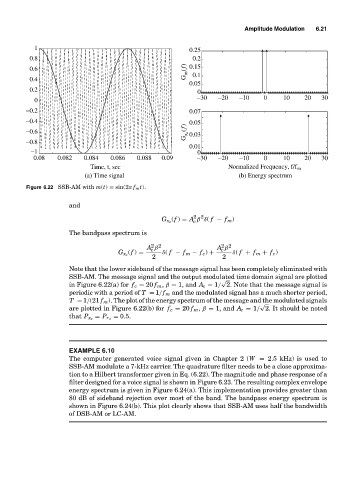
          Figure 6.22 SSB-AM with m(t) = sin(2π f m t).

                      and

                                                         2 2
                                                   (f ) = A β δ( f − f m )
                                                G x z    c
                      The bandpass spectrum is
                                                                 2 2
                                             2 2
                                            A β                A β
                                             c
                                                                 c
                                       (f ) =   δ( f − f m − f c ) +  δ( f + f m + f c )
                                    G x c
                                             2                   2
                      Note that the lower sideband of the message signal has been completely eliminated with
                      SSB-AM. The message signal and the output modulated time domain signal are plotted
                                                                 √
                      in Figure 6.22(a) for f c = 20 f m , β = 1, and A c = 1/ 2. Note that the message signal is
                      periodic with a period of T = 1/f m and the modulated signal has a much shorter period,
                      T = 1/(21 f m ). The plot of the energy spectrum of the message and the modulated signals
                                                                           √
                      are plotted in Figure 6.22(b) for f c = 20 f m , β = 1, and A c = 1/ 2. It should be noted
                                   = 0.5.
                      that P x z  = P r z
                      EXAMPLE 6.10
                      The computer generated voice signal given in Chapter 2 (W = 2.5 kHz) is used to
                      SSB-AM modulate a 7-kHz carrier. The quadrature filter needs to be a close approxima-
                      tion to a Hilbert transformer given in Eq. (6.22). The magnitude and phase response of a
                      filter designed for a voice signal is shown in Figure 6.23. The resulting complex envelope
                      energy spectrum is given in Figure 6.24(a). This implementation provides greater than
                      80 dB of sideband rejection over most of the band. The bandpass energy spectrum is
                      shown in Figure 6.24(b). This plot clearly shows that SSB-AM uses half the bandwidth
                      of DSB-AM or LC-AM.
   194   195   196   197   198   199   200   201   202   203   204