
Page 204 - Fundamentals of Communications Systems
P. 204
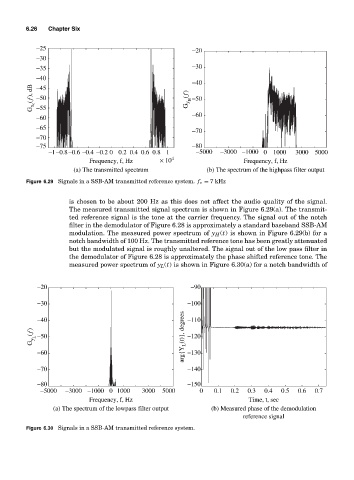
6.26  Chapter Six

              −25                                        −20
              −30
              −35                                        −30
              −40
                                                         −40
             G x c (f), dB  −50                         G y H (f)  −50
              −45
              −55
              −60                                        −60
              −65
                                                         −70
              −70
              −75                                        −80
                  −1−0.8−0.6  −0.4 −0.2 0 0.2 0.4  0.6 0.8 1  −5000  −3000 −1000 0 1000  3000 5000
                             Frequency, f, Hz    × 10 4                 Frequency, f, Hz
                         (a) The transmitted spectrum        (b) The spectrum of the highpass filter output
           Figure 6.29 Signals in a SSB-AM transmitted reference system. f c = 7 kHz


                       is chosen to be about 200 Hz as this does not affect the audio quality of the signal.
                       The measured transmitted signal spectrum is shown in Figure 6.29(a). The transmit-
                       ted reference signal is the tone at the carrier frequency. The signal out of the notch
                       filter in the demodulator of Figure 6.28 is approximately a standard baseband SSB-AM
                       modulation. The measured power spectrum of y H (t) is shown in Figure 6.29(b) for a
                       notch bandwidth of 100 Hz. The transmitted reference tone has been greatly attenuated
                       but the modulated signal is roughly unaltered. The signal out of the low pass filter in
                       the demodulator of Figure 6.28 is approximately the phase shifted reference tone. The
                       measured power spectrum of y L (t) is shown in Figure 6.30(a) for a notch bandwidth of


              −20                                        −90
              −30                                       −100

              −40                                       −110
             G y L (f)  −50                            arg{Y L (t)}, degrees  −120


              −60                                       −130

              −70                                       −140
              −80                                       −150
               −5000  −3000 −1000 0 1000    3000  5000      0   0.1  0.2  0.3  0.4  0.5  0.6  0.7
                             Frequency, f, Hz                            Time, t, sec
                   (a) The spectrum of the lowpass filter output  (b) Measured phase of the demodulation
                                                                        reference signal
           Figure 6.30 Signals in a SSB-AM transmitted reference system.