
Page 220 - Fundamentals of Computational Geoscience Numerical Methods and Algorithms
P. 220
8.4 Test and Application Examples of the Particle Simulation Method 211
3.50E+07
3.00E+07 SB = 100MPa
SB = 10MPa
SB = 1MPa
2.50E+07
Deviatoric Stress (Pa) 2.00E+07
1.50E+07
1.00E+07
5.00E+06
0.00E+00
0.00 0.04 0.08 0.12
Axial Strain
2
(A) 1× m sample
3.50E+07
SB = 100MPa
3.00E+07 SB = 10MPa
SB = 1MPa
2.50E+07
Deviatoric Stress (Pa) 2.00E+07
1.50E+07
1.00E+07
5.00E+06
0.00E+00
0.00 0.04 0.08 0.12
Axial Strain
(B) 1× km sample
2
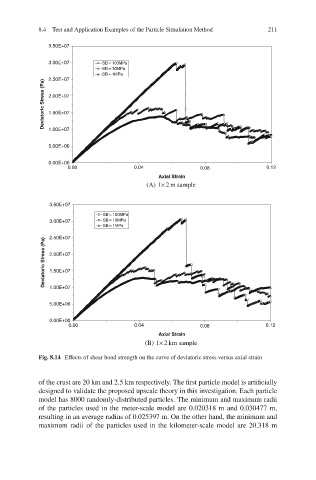
Fig. 8.14 Effects of shear bond strength on the curve of deviatoric stress versus axial strain
of the crust are 20 km and 2.5 km respectively. The first particle model is artificially
designed to validate the proposed upscale theory in this investigation. Each particle
model has 8000 randomly-distributed particles. The minimum and maximum radii
of the particles used in the meter-scale model are 0.020318 m and 0.030477 m,
resulting in an average radius of 0.025397 m. On the other hand, the minimum and
maximum radii of the particles used in the kilometer-scale model are 20.318 m