
Page 222 - Fundamentals of Computational Geoscience Numerical Methods and Algorithms
P. 222
8.4 Test and Application Examples of the Particle Simulation Method 213
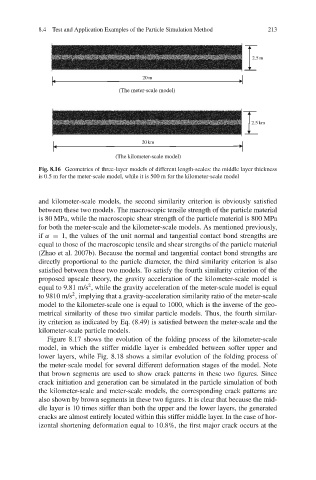
2.5 m
20 m
(The meter-scale model)
2.5 km
20 km
(The kilometer-scale model)
Fig. 8.16 Geometries of three-layer models of different length-scales: the middle layer thickness
is 0.5 m for the meter-scale model, while it is 500 m for the kilometer-scale model
and kilometer-scale models, the second similarity criterion is obviously satisfied
between these two models. The macroscopic tensile strength of the particle material
is 80 MPa, while the macroscopic shear strength of the particle material is 800 MPa
for both the meter-scale and the kilometer-scale models. As mentioned previously,
if α = 1, the values of the unit normal and tangential contact bond strengths are
equal to those of the macroscopic tensile and shear strengths of the particle material
(Zhao et al. 2007b). Because the normal and tangential contact bond strengths are
directly proportional to the particle diameter, the third similarity criterion is also
satisfied between these two models. To satisfy the fourth similarity criterion of the
proposed upscale theory, the gravity acceleration of the kilometer-scale model is
2
equal to 9.81 m/s , while the gravity acceleration of the meter-scale model is equal
2
to 9810 m/s , implying that a gravity-acceleration similarity ratio of the meter-scale
model to the kilometer-scale one is equal to 1000, which is the inverse of the geo-
metrical similarity of these two similar particle models. Thus, the fourth similar-
ity criterion as indicated by Eq. (8.49) is satisfied between the meter-scale and the
kilometer-scale particle models.
Figure 8.17 shows the evolution of the folding process of the kilometer-scale
model, in which the stiffer middle layer is embedded between softer upper and
lower layers, while Fig. 8.18 shows a similar evolution of the folding process of
the meter-scale model for several different deformation stages of the model. Note
that brown segments are used to show crack patterns in these two figures. Since
crack initiation and generation can be simulated in the particle simulation of both
the kilometer-scale and meter-scale models, the corresponding crack patterns are
also shown by brown segments in these two figures. It is clear that because the mid-
dle layer is 10 times stiffer than both the upper and the lower layers, the generated
cracks are almost entirely located within this stiffer middle layer. In the case of hor-
izontal shortening deformation equal to 10.8%, the first major crack occurs at the