
Page 390 - Fundamentals of Gas Shale Reservoirs
P. 390
370 GAS SHALE CHALLENGES OVER THE ASSET LIFE CYCLE
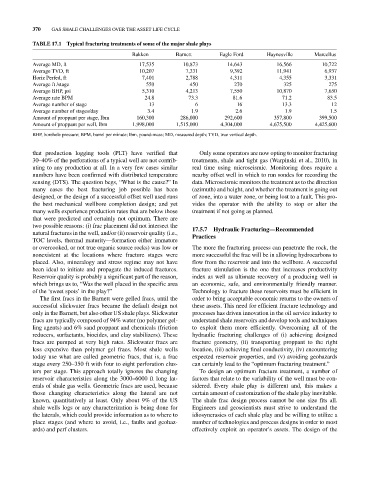
TABLE 17.1 Typical fracturing treatments of some of the major shale plays
Bakken Barnett Eagle Ford Haynesville Marcellus
Average MD, ft 17,535 10,873 14,643 16,566 10,722
Average TVD, ft 10,207 7,331 9,392 11,941 6,937
Horiz Perfed, ft 7,401 2,788 4,311 4,355 3,331
Average ft /stage 550 450 270 325 275
Average BHP, psi 5,310 4,213 7,550 10,870 7,650
Average rate BPM 24.8 73.3 81.6 71.2 83.5
Average number of stage 13 6 16 13.3 12
Average number of stages/day 3.4 1.9 2.6 1.9 1.5
Amount of proppant per stage, Ibm 160,300 286,000 292,600 357,800 399,500
Amount of proppant per well, Ibm 1,998,000 1,515,000 4,304,000 4,675,500 4,425,600
BHP, borehole pressure; BPM, barrel per minute; lbm, pound-mass; MD, measured depth; TVD, true vertical depth.
that production logging tools (PLT) have verified that Only some operators are now opting to monitor fracturing
30–40% of the perforations of a typical well are not contrib- treatments, shale and tight gas (Warpinski et al., 2010), in
uting to any production at all. In a very few cases similar real time using microseismic. Monitoring does require a
numbers have been confirmed with distributed temperature nearby offset well in which to run sondes for recording the
sensing (DTS). The question begs, “What is the cause?” In data. Microseismic monitors the treatment as to the direction
many cases the best fracturing job possible has been (azimuth) and height, and whether the treatment is going out
designed, or the design of a successful offset well used runs of zone, into a water zone, or being lost to a fault. This pro-
the best mechanical wellbore completion design; and yet vides the operator with the ability to stop or alter the
many wells experience production rates that are below those treatment if not going as planned.
that were predicted and certainly not optimum. There are
two possible reasons: (i) frac placement did not intersect the 17.5.7 Hydraulic Fracturing—Recommended
natural fractures in the well, and/or (ii) reservoir quality (i.e., Practices
TOC levels, thermal maturity—formation either immature
or overcooked, or not true organic source rocks) was low or The more the fracturing process can penetrate the rock, the
nonexistent at the locations where fracture stages were more successful the frac will be in allowing hydrocarbons to
placed. Also, mineralogy and stress regime may not have flow from the reservoir and into the wellbore. A successful
been ideal to initiate and propagate the induced fractures. fracture stimulation is the one that increases productivity
Reservoir quality is probably a significant part of the reason, index as well as ultimate recovery of a producing well in
which brings us to, “Was the well placed in the specific area an economic, safe, and environmentally friendly manner.
of the ‘sweet spots’ in the play?” Technology to fracture these reservoirs must be efficient in
The first fracs in the Barnett were gelled fracs, until the order to bring acceptable economic returns to the owners of
successful slickwater fracs became the default design not these assets. This need for efficient fracture technology and
only in the Barnett, but also other US shale plays. Slickwater processes has driven innovation in the oil service industry to
fracs are typically composed of 94% water (no polymer gel- understand shale reservoirs and develop tools and techniques
ling agents) and 6% sand proppant and chemicals (friction to exploit them more efficiently. Overcoming all of the
reducers, surfactants, biocides, and clay stabilizers). These hydraulic fracturing challenges of (i) achieving designed
fracs are pumped at very high rates. Slickwater fracs are fracture geometry, (ii) transporting proppant to the right
less expensive than polymer gel fracs. Most shale wells location, (iii) achieving final conductivity, (iv) encountering
today use what are called geometric fracs, that is, a frac expected reservoir properties, and (v) avoiding geohazards
stage every 250–350 ft with four to eight perforation clus- can certainly lead to the “optimum fracturing treatment.”
ters per stage. This approach totally ignores the changing To design an optimum fracture treatment, a number of
reservoir characteristics along the 3000–6000 ft long lat- factors that relate to the variability of the well must be con-
erals of shale gas wells. Geometric fracs are used, because sidered. Every shale play is different and, this makes a
those changing characteristics along the lateral are not certain amount of customization of the shale play inevitable.
known, quantitatively at least. Only about 9% of the US The shale frac design process cannot be one size fits all.
shale wells logs or any characterization is being done for Engineers and geoscientists must strive to understand the
the laterals, which could provide information as to where to idiosyncrasies of each shale play and be willing to utilize a
place stages (and where to avoid, i.e., faults and geohaz- number of technologies and process designs in order to most
ards) and perf clusters. effectively exploit an operator’s assets. The design of the