
Page 119 - Fundamentals of Light Microscopy and Electronic Imaging
P. 119
102 PHASE CONTRAST MICROSCOPY AND DARK-FIELD MICROSCOPY
P wave
S wave
D wave
A
λ λ ~ ∆
4 20
λ
(a)
Φ
D
S
ϕ
P
(b)
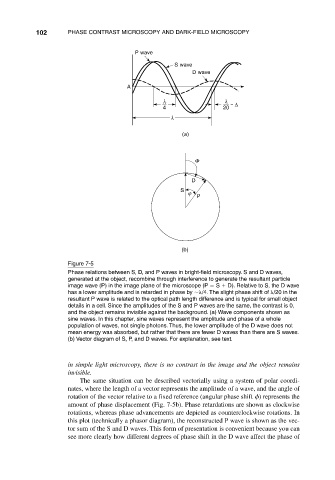
Figure 7-5
Phase relations between S, D, and P waves in bright-field microscopy. S and D waves,
generated at the object, recombine through interference to generate the resultant particle
image wave (P) in the image plane of the microscope (P S D). Relative to S, the D wave
has a lower amplitude and is retarded in phase by /4. The slight phase shift of /20 in the
resultant P wave is related to the optical path length difference and is typical for small object
details in a cell. Since the amplitudes of the S and P waves are the same, the contrast is 0,
and the object remains invisible against the background. (a) Wave components shown as
sine waves. In this chapter, sine waves represent the amplitude and phase of a whole
population of waves, not single photons. Thus, the lower amplitude of the D wave does not
mean energy was absorbed, but rather that there are fewer D waves than there are S waves.
(b) Vector diagram of S, P, and D waves. For explanation, see text.
in simple light microscopy, there is no contrast in the image and the object remains
invisible.
The same situation can be described vectorially using a system of polar coordi-
nates, where the length of a vector represents the amplitude of a wave, and the angle of
rotation of the vector relative to a fixed reference (angular phase shift ) represents the
amount of phase displacement (Fig. 7-5b). Phase retardations are shown as clockwise
rotations, whereas phase advancements are depicted as counterclockwise rotations. In
this plot (technically a phasor diagram), the reconstructed P wave is shown as the vec-
tor sum of the S and D waves. This form of presentation is convenient because you can
see more clearly how different degrees of phase shift in the D wave affect the phase of