
Page 106 - Fundamentals of Water Treatment Unit Processes : Physical, Chemical, and Biological
P. 106
Unit Process Principles 61
Looking at Figure 4.2, the flux density varies along C 0 C 0
the curve as the slope, qC=qZ changes and is highest at the t=0
inflection point of each curve (the steepest part of the curve). t>0
As time increases, the C(Z) t curve becomes flatter and there-
C C
fore the flux density at any Z is less; for example, at
time (t þ Dt) as compared with time, t. 0 0
If we apply Equation 4.1 to an infinitesimal volume and (a) 0 Z (b) 0 Z
let the mass accumulate in that volume, the rate of accumula-
C 0
tion is
t >> 0
qC 2
¼ Dr C (4:3)
qt C
0
in which t is the elapsed time (s). (c) 0 Z
Equation 4.3 is Fick’s second law. Really it is the math-
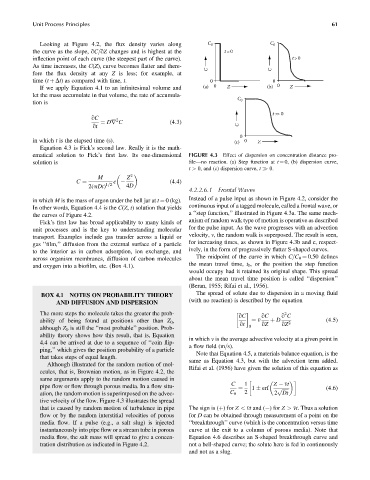
ematical solution to Fick’s first law. Its one-dimensional FIGURE 4.3 Effect of dispersion on concentration distance pro-
solution is file—no reaction. (a) Step function at t ¼ 0, (b) dispersion curve,
t > 0, and (c) dispersion curve, t 0.
2
M Z
(4:4)
C ¼ 1=2 e
2(pDt) 4D
4.2.2.6.1 Frontal Waves
Instead of a pulse input as shown in Figure 4.2, consider the
in which M is the mass of argon under the bell jar at t ¼ 0 (kg).
continuous input of a tagged molecule, called a frontal wave, or
In other words, Equation 4.4 is the C(Z, t) solution that yields
a ‘‘step function,’’ illustrated in Figure 4.3a. The same mech-
the curves of Figure 4.2.
anism of random walk type of motion is operative as described
Fick’s first law has broad applicability to many kinds of
for the pulse input. As the wave progresses with an advection
unit processes and is the key to understanding molecular
transport. Examples include gas transfer across a liquid or velocity, v, the random walk is superposed. The result is seen,
gas ‘‘film,’’ diffusion from the external surface of a particle for increasing times, as shown in Figure 4.3b and c, respect-
to the interior as in carbon adsorption, ion exchange, and ively, in the form of progressively flatter S-shaped curves.
across organism membranes, diffusion of carbon molecules The midpoint of the curve in which C=C 0 ¼ 0.50 defines
and oxygen into a biofilm, etc. (Box 4.1). the mean travel time, t 0 , or the position the step function
would occupy had it retained its original shape. This spread
about the mean travel time position is called ‘‘dispersion’’
(Beran, 1955; Rifai et al., 1956).
BOX 4.1 NOTES ON PROBABILITY THEORY The spread of solute due to dispersion in a moving fluid
AND DIFFUSION AND DISPERSION (with no reaction) is described by the equation
The more steps the molecule takes the greater the prob- 2
qC qC q C
ability of being found at positions other than Z 0 , ¼ v þ D 2 (4:5)
qt qZ qZ
although Z 0 is still the ‘‘most probable’’ position. Prob- 0
ability theory shows how this result, that is, Equation
in which v is the average advective velocity at a given point in
4.4 can be arrived at due to a sequence of ‘‘coin flip-
a flow field (m=s).
ping,’’ which gives the position probability of a particle
Note that Equation 4.5, a materials balance equation, is the
that takes steps of equal length.
same as Equation 4.3, but with the advection term added.
Although illustrated for the random motion of mol-
Rifai et al. (1956) have given the solution of this equation as
ecules, that is, Brownian motion, as in Figure 4.2, the
same arguments apply to the random motion caused in
C 1 Z vt
pipe flow or flow through porous media. In a flow situ- 1 erf (4:6)
¼ p ffiffiffiffiffi
ation, the random motion is superimposed on the advec- C 0 2 2 Dt
tive velocity of the flow. Figure 4.3 illustrates the spread
that is caused by random motion of turbulence in pipe The sign is (þ) for Z < vt and ( ) for Z > vt. Thus a solution
flow or by the random interstitial velocities of porous for D can be obtained through measurement of a point on the
media flow. If a pulse (e.g., a salt slug) is injected ‘‘breakthrough’’ curve (which is the concentration versus time
instantaneously into pipe flow or a stream tube in porous curve at the exit to a column of porous media). Note that
media flow, the salt mass will spread to give a concen- Equation 4.6 describes an S-shaped breakthrough curve and
tration distribution as indicated in Figure 4.2. not a bell-shaped curve; the solute here is fed in continuously
and not as a slug.